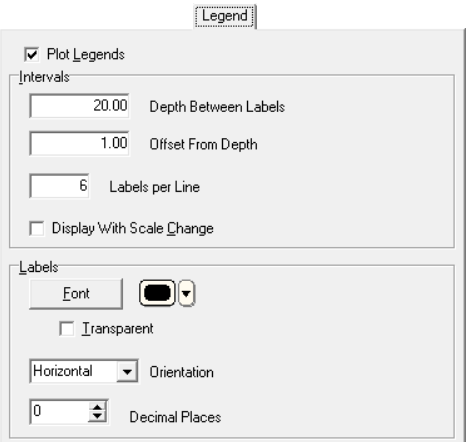
The Legend tab in the Curve Column setup window is used to activate and configure automatic values labels that can be plotted at periodic intervals in a Curve column.
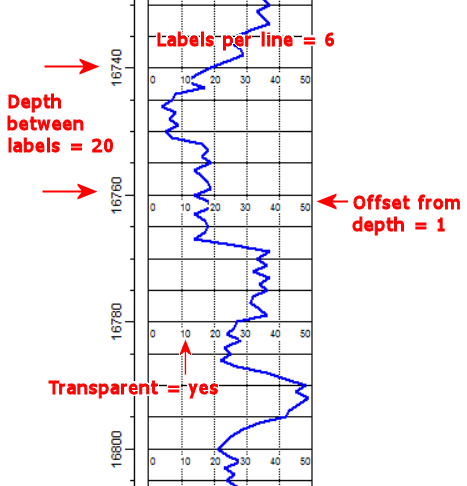
Depth Between Labels: Type in the depth interval between the automatic labels. For example, if you want labels to appear every 20 feet on the log, type in "20". For every 100 meters (if those are your depth units) type in "100".
Offset from Depth: This controls how far above or below the actual depth the top of the label text will be placed. This can be helpful to avoid overplotting on regularly-spaced depth grid lines. Some examples:
> To position the top of the labels directly at the declared depth intervals, enter "0".
> To place the top of the labels 1 foot below the depth intervals, enter "1".
> If you want to bump the labels above the depth intervals, you need to enter the offset as a negative value; "-2" will place the top of the label text 2 feet above each depth interval.Labels per line: Type in the number of labels to appear at each depth interval. This will include the minimum column and maximum column values at either side of the column, and any additional labels in between.
Tip: If you have activated the column's value grid, set the Labels per line to the same value as the Major Interval Divisions plus 1. For example, if your value grid is set to 5 major divisions, set the Labels per line to 6.
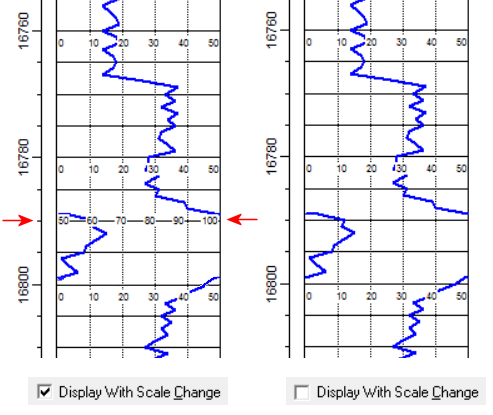
Display with scale change: If you have selected any curve wrapping (appearance tab) or horizontal scaling via a Curve Scale Table, you can request the legend labels be plotted to reflect the wrapped scale change. Here's an example:
Font: Click on this button to select the font, size, style, and color for the automatic legend labels, and click OK.
Color: Click here to select the font color. This can also be set via the Font button.
Transparent: Insert a check in this box if any background grid or curve lines are to show through the label text block. Leave this box cleared if the label text is to block out any background items. Compare the examples below.
Orientation: Choose Horizontal or Vertical for the label orientation.
Decimal Places: Select the number of decimals to be represented in the labels.
![]() Back to main topic
Back to main topic
![]()