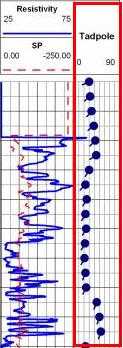
This excerpt illustrates a Tadpole column. The program permits you to plot the tadpoles with constant or variable colors, in different symbol styles.
Introduction
Example
How to enter Tadpole Data
Use: The LogPlot Tadpoles datasheet is used to list depths and dip direction and dip angle for downhole structural (dipmeter) measurements. Optional fields include color and value. This information can be displayed in a Tadpole column in the log design.
Corresponding log design component: This structural information will be plotted on the log in the Tadpole Column of the same name.
Corresponding RockWorks data table: none
Right-Click Options: When you right-click in any of the Tadpole datasheet's cells, you have the following options:
Cut, Copy, Paste Insert/Append/Delete Rows Manipulate Columns Edit Data Page Name Delete Data Page Move
This excerpt illustrates a Tadpole column. The program permits you to plot the tadpoles with constant or variable colors, in different symbol styles.
Automatic:
If there is already a Tadpole column in the current log design to which you will be linking the data, you can use the Data | Update Data File from Log Design menu option to insert a new Tadpoles datasheet in the current data file. The program will know how to name the tab based on the log design information.
Manual:
Select the Data | New Data Page | Tadpole menu option to manually insert a Tadpoles datasheet.
New Name: Type in the name to assign to the datasheet. LogPlot will use this name to match data to the item in the log design.
Click OK.
The program will add to the data file a Tadpoles datasheet labeled with the selected name and with five blank columns: Depth, Azimuth, Dip, Color, and Value.

Name: The name displayed on the data tab is used to match the data to a particular Tadpoles column in the log design. This name is declared when you first create the data page (above) and can be edited by right-clicking in the body of the data tab, and choosing Edit Data Page Name.
Depth: In this column list the depths at which the measurements were taken.
Azimuth: In this column enter the dip direction in 0 to 360 azimuth degrees. The bearings will be represented by the tadpole tails which will be oriented straight up for north-bearing dips and straight down for south-bearing dips.
Dip: In this column, enter the dip angles, where 0 = horizontal and 90 = vertical. Dip angle is represented by the placement of the tadpole symbol within the column: zero-degree (horizontal) dip angles are represented with symbols plotted along the left edge of the column, and 90 degree (vertical) dip angles are shown by symbols along the right edge of the column.
Color: (Optional) Double-click in this cell to select a color for the measurement's tadpole symbol. If you choose to define specific colors for individual samples, be sure to set the Tadpole column to a "Column-Based" color scheme.
Value: (Optional) This column is used to enter quantitative values for the measurements, for use in scaling the tadpole symbols. In the Tadpole column options you can specify that symbol size either is fixed (and these values are ignored) or is based on the numbers in this value column, with a minimum and maximum size defined for the value range.
![]() Back to LogPlot Datasheet Summary
Back to LogPlot Datasheet Summary
![]()

