![]() Time: 2 minutes
Time: 2 minutes
On the next screen is listed all of the curves in the LAS file, referenced with the name, the curve units, the API number, and description.
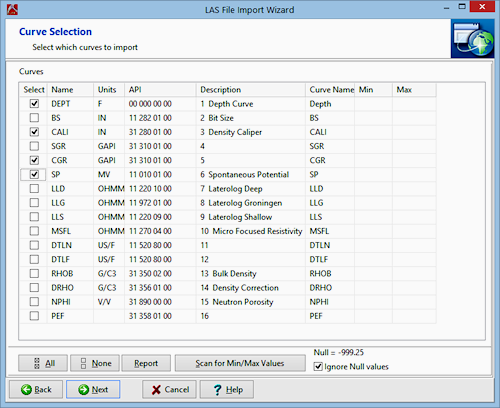
Insert a check in the Ignore Null Values check-box to be sure the null value is not included in the next step.
The program will display these values in the "Min" and "Max" columns in the window. This information can be very handy in knowing how to scale the curve column in the log.
Tip: In your own work, you may want to edit the curve names (in the Name column) either to assign them more intuitive names or to match curve names in an existing log design.
![]() Back to menu | Next ( Set up the import options )
Back to menu | Next ( Set up the import options ) ![]()
![]()