 Estimated time: 3 minutes.
In this lesson, you will look at how downhole "Point" data is entered, how the columns are defined, how to edit the data as a "datasheet", and how to query the data based on p-data value ranges.
- Be sure the "Samples" folder is still the current project folder (see Open a Project for information).
- In the borehole file listing along the left side of the Borehole Manager, click on the borehole named DH-02 to make it active.
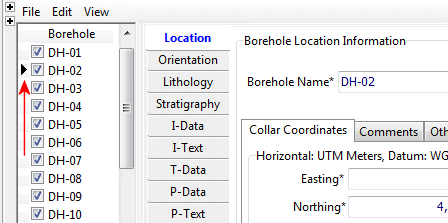
- Click on the P-Data button to view the table.

! Note how each row contains a single depth, and multiple columns of measurements. These values can represent gamma, resistivity, other elog data, drilling rate, or any point-sampled downhole data. (What RockWorks calls "interval" data – in an earlier lesson set – is entered with a top and bottom depth, and measurement(s) for the interval.) If a component has no measurement for a particular depth, it can be left blank.
- Click on the borehole DH-04 in the list to the left, and you’ll see the information listed in the P-Data table for this hole.
There's no limit to the number of components for which you can enter measurements. Let's take a look.
- Look at the project's P-Data Types:
- With the P-Data table visible (for any borehole) click on the P-Data Types button that is displayed above the data. The program will display the current P-Data setup.
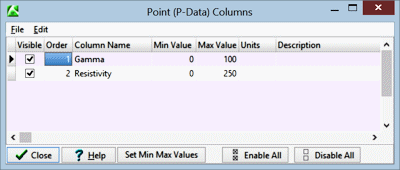
This defines for each component type its name and its min and max values. You can also enter comments regarding units and descriptive notes. The Order value determines the column order in the Borehole Manager display, and the Visible checkbox defines whether the column is visible or not.
In your own work you can add components to the P-Data table (and columns to the Borehole Manager display) by clicking in the last shown row, pressing the down-arrow key, and defining these fields for the new measurement type.
- Click on the Close button to close the Point (P-Data) Columns window.
- Edit Data as Datasheet: Note that even though the data displayed in the P-Data table looks like a spreadsheet, it is not. It's actually a complicated merging of many records stored in the Borehole Manager's Point Data and Point Data Type tables. Because of this, you cannot select a block of cells like you can within a spreadsheet-type display, or copy/paste blocks of cells.
There is, however, a handy tool in the Edit menu that makes editing this data quite easy.
- Click on the Datasheet button at the top of any of the boreholes' P-Data listings (or select the Edit | Edit Data as Datasheet option).
- The program will load the contents of the current P-Data table for the current borehole into a true row-and-column datasheet window. Here you can select blocks of cells, copy and paste from other applications, etc.
- Close this window by clicking the Cancel button, and respond Yes to the Cancel-all-changes prompt.
 Entering P-Data
 Back to P-Data menu | Next (3D logs)

RockWare home page