 Estimated time: 3 minutes.
In this lesson, you will create a multi-paneled set of section panels using the same lithology model you created in the previous lesson. The instructions below are written with the assumption that you have completed that lesson, as well as the lesson on log sections. You'll be using the same settings for the lithology cross section.
- Click on the Lithology Menu and choose Section.
- Set up the section options:
- Lithology Modeling Options: Establish the modeling settings.
 Use Existing Model: Click in this button to tell the program you want to use the same, existing lithology model file. Expand this heading if necessary.
- Model Name: Click here to select the file named "lithology.RwMod", created in the previous lesson.
- Fill Options:
 Fill Background: Check this box to be sure that the background colors for the rock types are displayed in the section.
- Plot Patterns: Check this box to display the pattern designs as well.
- Confirm the following settings are still established, from the log section lesson:
- Lithology Legend.
- Plot Logs: The program will append 2D logs to the section panels.
- or
 Plot Surface Profile: This option can be either checked or not, as per the log section lesson.
- Show Faults: Turn this option off.
- Perimeter Annotation Options: The defaults from the earlier lesson should work.
- Create Location Map.
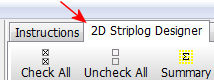
- Check the striplog options: These should still be set up as they were for the log section; if you want to review the 2D log settings you can click on the 2D Striplog Designer tab to the right.
- Check the selected boreholes: These should also still be set up as they were for the log section. To verify the placement of the section trace, click on the Section Selection Map tab to the right.

- Process: When you're ready to proceed, click the Process button at the bottom of the window.
The program will read the existing solid model (lithology.RwMod) and extract panels along the indicated cross-section trace. It will build them into a continuous cross section diagram, with the indicated perimeter annotation and surface profile line. The lithology logs will be appended to the section diagram. The completed diagram will be displayed in a RockPlot2D tab in the options window.
- Resize the plot window as necessary: You can adjust the display by:
- Clicking on the small "+" button between the options and the plot window, to hide the left-hand menu pane (example below).
- Dragging the window corners to adjust the overall window size.
- Save the image: Choose File|Save and save this diagram under the name: lith panel section and click Save.
- Resize the lithology legend:
- Click on the Edit arrow in the upper-left corner.

- Click on the lithology legend to the right of the section.
- Position the cursor on the lower-right corner of the legend rectangle, on the handle; you'll see the cursor shape change to

- Click on that handle, hold down the mouse, and drag slightly to the right. The legend will be rescaled in the new rectangular space.
- If you want to view some of the legend options, you can double-click on the Lithology Legend.
- Click OK to close the Legend Attributes window.
- Layers:
- Find the Layers pane in the RockPlot2D window in the upper-right. (If it is hidden, you can display this pane by clicking on the small "+" button in the upper-right corner.)

- Use the check-boxes displayed there to turn on/off some of the different components of the diagram, such as different rock types or annotations.
- If you want to fill the plot window with the diagram, click the stretch button.
 If you ever want to get back to the original 1:1 scale of the section, click the VE: button at the top of the window, and enter: 1.
- Save the changes you've made: click the
 button.
- Close the section window.
 Lithology Sections, Editing RockPlot2D Images
 Back to Lithology menu | Next (volume report)

RockWare home page