
RockWorks | Utilities | Statistics | Ternary | Multiple (Map)
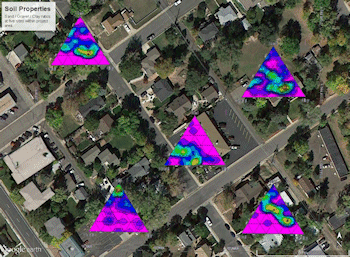
This program is used to read a list of RwDat files which have the same layout, and generate a series of trilinear diagrams from the data in each file. The individual ternary diagrams will be displayed in a map view centered at their defined X,Y coordinates.
! The individual ternary diagram settings - the source columns in the input files and the diagram appearance options - are those which are currently stored for the Ternary | Single program. We recommend you run a few of the input datasheet files through that option to be sure the settings generate diagrams which are to your liking.
Menu Options
Step-by-Step Summary
Menu Options
- Input Columns: Select the input data from the left side of the program window.
- File Name: Click the down-arrow to select the name of the datasheet column in which the names of the individual RwDat datasheet files are listed. It is these files which contain the data for the separate ternary diagrams which will be displayed in the map view.
! It is important that each of the files listed here have the same data layout.
- Midpoint X: Click to select the name of the column in the file that contains the X coordinate for the midpoint of the diagram.
The X and Y coordinates can be Eastings in meters or feet, decimal longitudes, etc. See Defining your Datasheet Coordinates for more information.
- Midpoint Y: Click to select the name of the column in the datasheet that contains the Y coordinate for the diagram midpoints.

- Width: Click to the right to type in the width for each ternary diagram in the map, expressed as a percent of your project size. (Default = 5.0)
- Height: Click to the right to type in the height for each ternary diagram in the map, expressed as a percent of your project size. (Default = 5.0)
- Border: Check this to include a border around the ternary map which shows the coordinate range of the axes. Expand this heading to establish the border options.
Step-by-Step Summary
- Access the RockWorks Utilities datasheet.
- Enter/open/import the data for each sample site into the datasheet. These individual files must contain 3 or more columns of measurements which are to be represented in the ternary diagrams. Be sure to save each file under a unique RwDat file name.
- Use the Statistics | Ternary | Single menu option to create a ternary diagram of one or more of these data files. The settings you establish at this time will be used for all of the individual diagrams in the Ternary Map.
- Create a new RwDat file which lists the names of these data files, and their X Y locations. (Each ternary diagram will be centered at these locations.) See the graphic above for an example of the "Ternary_Map.RwDat" sample file layout.
- Select the Statistics | Ternary | Multiple (Map) menu option.
- Enter the menu settings, described above.
- Click the Process button to continue.
The program will read the first RwDat file listed in the datasheet, locate the data for each variable as defined in the Ternary | Single menu, and generate a ternary diagram for these data using the diagram settings. It will repeat this process for the next RwDat files listed in the datasheet. Once the diagram is completed for each site, RockWorks will build a map with each plot centered at the declared X and Y coordinates. The completed map will be displayed in a RockPlot2D tab in the Options window.
- You can adjust any of the diagram options along the left and click the Process button to regenerate the ternary map.
! Each time you click the Process button, the existing display will be replaced.
- View / save / manipulate / print / export the map in the RockPlot2D window. (More.)
Tip: Click the Google Earth button at the top of the plot window to display the map in Google Earth.
 Back to Statistics Menu Summary

RockWare home page