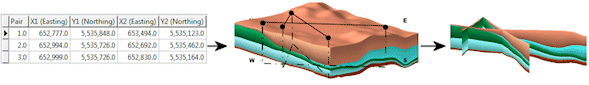
An "XY Pair" table is used to define a listing of X,Y coordinate locations to be used to define the panel endpoints in a RockWorks fence diagram. Though you can interactively draw fence panel locations, the program also allows you to create a coordinate listing such as this, should you need really precise locations or wish to run the program in command (RCL) mode.
! You can maintain multiple XY Pair tables in your project database. If you assign detailed names they'll be easy to distinguish when you're selecting which to use. XY Pair tables can be accessed in the Project Manger, under the Project Tables | Log/Section Tables grouping.
Tip:
- Use the interactive fence drawing window to define the panel locations, and export the points to an XY Pair table.
- Use the Draw | Polyline or Draw | Line tool in RockPlot2D to draw polylines or lines on a map and save them to an XY Pairs table.
Table Format
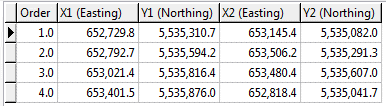
- Order: The first column simply lists the order of the coordinate pairs and, hence, the sequence in which the panels will be drawn in RockPlot3D. This can be any real number value, though you'll probably number your rows "1", "2", "3", etc.
- X1 (Easting), Y1 (Northing): These columns list the X and Y coordinates for one endpoint of the fence panel.
- X2 (Easting), Y2 (Northing): These columns list the X and Y coordinates for the other endpoint of the fence panel.
See also:

RockWare home page