RockWorks | Utilities | Solid | Filters | Continuity
Use this program to identify contiguous blocks of voxels that have the same, or close to the same, G-values. Example applications include:
- Hydrogeology: Delineate aquifers and aquitards within a lithologic model. A clay unit that overlies an aquifer may be essentially impermeable, but if it's not laterally contiguous the aquifer may not be "confined".
- Mining: Consider mineralization along a shear zone. The Continuity Filter can be used to identify the contiguous ore-grade zones like beads along a chain. Eliminating the sub-economic "beads" can assist in a the creation of a profitable extraction plan.
- Petroleum: By Continuity-Filtering a pay-zone, we can predict just how much of the zone can be effectively drained.
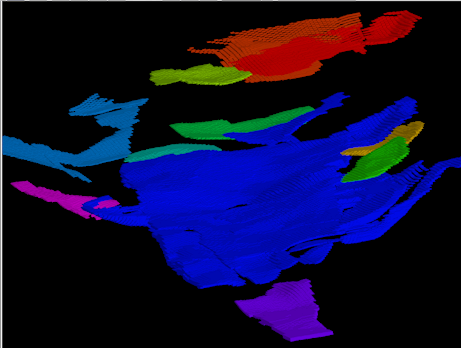
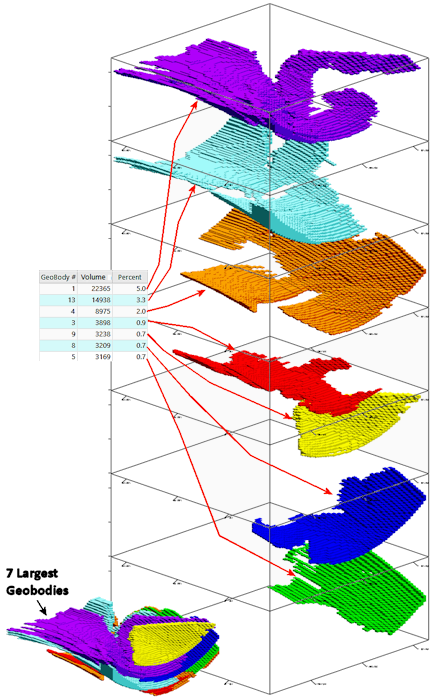
The program will output a new solid model with nodes (which fit within the user's defined G value range) reassigned with geobody numbers. Discontinuous blocks of nodes will be assigned different geobody numbers. A "Contiguous Units" report will list the separate geobodies with their assigned numbers, volumes, and percent of the volume of all of the geobodies.
Menu Options
Step-by-Step Summary
Menu Options
- Input Model: Click to the right to select the name of the existing RockWorks solid model file (*.RwMod) to be filtered.
- Output Model: Click to the right to type in the name to assign to the new solid model that the program will create, which results from the filtering operation.
- Minimum G Value: Click here to type in the minimum G value in the source model to be included in the output geobodies.
- Maximum G Value: Click here to type in the maximum G value in the source model to be included in the output geobodies.
For example, if porous lithotypes within a lithology model have been assigned "groupable" values (e.g. Sand=5, Gravelly Sand=6, Sandy Gravel=7, Gravel=8), then assigning the Minimum G-Value to 5.0 and the Maximum G-Value to 8.0 will identify geobodies (contiguous regions) composed of Sand, and/or Gravelly Sand, and/or Sandy Gravel, and/or Gravel.
- Remove Small Geobodies: Check this box if you want small geobodies to be removed from the output.
- Minimum % of Model Volume: Click here to type in the percent of model volume below which will be considered a "small geobody" and removed from the output.
- Create 3-Dimensional Diagram: Insert a check here if you want to create a plottable 3D diagram of the resulting solid model with all of the output geobodies. Expand this item to establish the diagram settings.
- Diagram Type: Choose Isosurface to display the solid model as if enclosed in a "skin". Choose All Voxels to display color-coded voxels. (More.)
- Iso-Mesh: Use this option to plot a series of polylines that represent three-dimensional contours at a user-defined cutoff. Expand the heading to establish the settings. (More.)
- Color Scheme: Click on the Options button to the right to access a variety of pre-set color schemes, or to create your own. (More.)
- Cage: Insert a check here to include vertical elevation axes and X and Y coordinate axes in the 3D diagram. Expand this item to set up the cage items. (More.)
- Legend: Insert a check here to include an index to the colors and G values in the diagram. (More.)
Step-by-Step Summary
- Access the RockWorks Utilities program tab.
- Select the Solid | Filters | Continuity Filter menu option.
- Specify the menu settings, described above.
- Click the Process button to proceed.
The program will read the contents of the input solid model file and compare the value of each input node to the min-max value range defined above. It will then determine which of the included nodes are contiguous with other included nodes and group them within a single "geobody". Separate geobodies will be assigned sequential integer values ("1", "2", "3", etc.) in the order in which they are . The nodes in each resulting contiguous geobody will be re-assigned the geobody number. The resulting solid model file will be stored under the declared output file name. If you have requested a diagram, it will be displayed in a RockPlot3D tab. The Contiguous Units report will be displayed in a data tab.
- You can adjust any of the input options along the left side of the window and click the Process button again to regenerate the display.
! Each time you click the Process button, the existing 3D display will be replaced.
- View / save / manipulate / print the image in the RockPlot3D window.
 Back to Solid Menu Summary

RockWare home page