RockWorks | Utilities | Planes | Polylines->Planes
This program reads xyz polyline coordinates from an ASCII file and computes the orientations of planes that pass through the polyline vertices. It is designed for applications in which the user has xyz coordinates that represent the intersections between fractures or contacts and surface topography. By computing the orientations of planes that pass through these points, it is possible to analyze and/or visualize the relative positions and orientations of these structures.
Menu Options
- Input File: Tab-delimited ASCII file that contains one or more polygon definitions. See example below.
- Estimation Method(s): Defines the technique used to determine orientation of plane that passes through polyline points. Note that it is possible to activate both of these methods so that the user may readily compare the results of each method.
- 3-Points: Plane orientation is computed by fitting a plane to the first polyline point, the last polyline point, and the median polyline point. The Polyline -> Planes will generate one row of data for each polyline. This row will include the xyz coordinates for the three aforementioned points. The resultant triangles may be plotted with the Grafix | 3D Utilities | Triangles program.
- Color: Color that will be saved within "Color" column for planes that are calculated via the 3-point method.
- 1st-Order Polynomial: Plane orientation is computed by fitting a plane to all polyline points. Unlike the 3-point method, this option computes four triangles (rows of data) for each plane. The construction of this plane is described below under the heading "Constructing The 1st-Order Polynomial Plane".
- Color: Color that will be saved within "Color" column for planes that are calculated via the 1st-order polynomial method.
- Projection Distance: This is the distance, both up-dip and down-dip, that will be used to determine the overall size of the projected plane (see diagram below).
- Save Projected Points: This option will create tab-delimited ASCII files (one for each polyline) that contain the xyz coordinates for the projected points (M,C1,C2,C3, and C4 within the diagram below).
- Output Folder: Directory in which new files are to be saved.
- File Name Prefix: Text string to use as a prefix to the polygon names when creating the xyz files. For example, if a polygon name is "N14J" and the File Name Prefix is set to "Fault", the data will be stored within a file called "Fault_N14J.txt".
- Output Style: The orientation of the planes may be computed in one of two ways:
- Dip Direction: The data within the Direction column will represent the dip-direction in a 0 to 360 degree format. When this option is checked, the title for the direction column will be set to "Dip Direction".
- Strike: The data within the Direction will represent the strike of the plane. The dip will adhere to the right-hand rule. When this option is checked, the title for the direction column will be set to "Strike".
- Decimals:
- X & Y Coordinates: Number of decimal places used when displaying x (easting) and y (northing) coordinates.
- Z Coordinates: Number of decimal places used when displaying z (elevation) units.
Input File: The input format (a RockWare Polyline File) consists of a tab-delimited ASCII file as depicted by the following example:
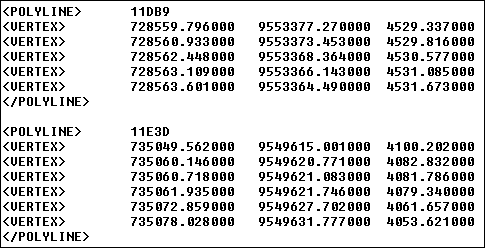
Tab-delimited polyline file.
Constructing The 1st-Order Polynomial Plane: The four triangles that comprise the 1st-order polynomial plane is constructed in the following fashion:
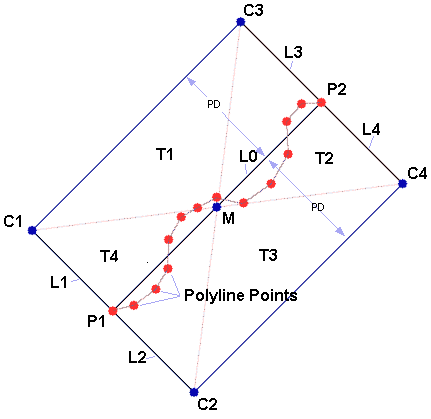
- An imaginary line (L0) is drawn from the first polyline point (P1) to the last polyline point (P2).
- Four new imaginary lines (L1 through L4), perpendicular to the aforementioned line, are drawn from the first polyline point (P1) and the last polyline point (P2). The length of these lines are defined by the "Projection Distance" setting (PD).
- The xy coordinates (C1 through C4) at the ends of these lines (L1 through L4) are then computed.
- The 1st-order polynomial equation is then used to predict the z-coordinates at these endpoints (C1 through C4).
- The xy coordinates for the midpoint (M) between the first (P1) and last (P2) polyline point is computed.
- The 1st-order polynomial equation is then used to predict the z-coordinate for the midpoint (M).
- Four triangles (T1 through T4) and then constructed between the midpoint (M) and the corner points (C1 through C4).
Program Output: Upon completion, the Polylines -> Planes program will generate a table that includes the polyline title, the xyz coordinates for the triangle vertices, and the dip-direction (or strike) and the dip. Note that the user has the option to export triangles based on either three points or the projected plane.
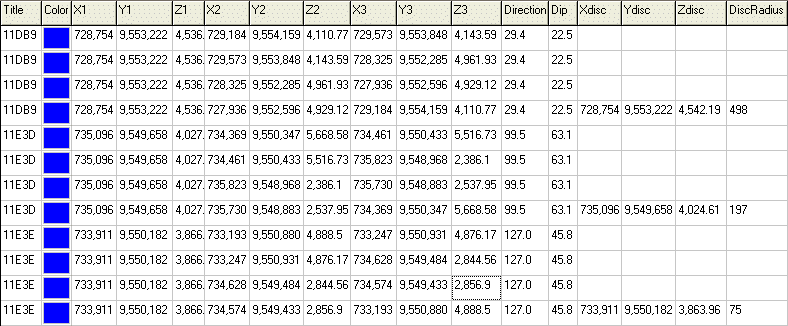
Sample output from Polylines -> Planes program.
For each plane, the output file contains four triangles (x1,y1,z1,x2,y2,z2,x3,y3,z3) that are used plot generate diagrams via the Grafix | 3D Utilities | Triangles program. The program also creates the following columns for subsequent plotting via the Planes | Strike & Dip Diagram (3D) program:
- Xdisc: The x-coordinate of the midpoint of a line connecting the first polyline vertex with the last polyline vertex.
- Ydisc: The y-coordinate of the midpoint of a line connecting the first polyline point with the last polyline vertex.
- Zdisc: The z-coordinate of the midpoint of a line connecting the first polyline point with the last polyline vertex.
- DiscRadius: One half of the distance between the first polyline vertex and the last polyline vertex.
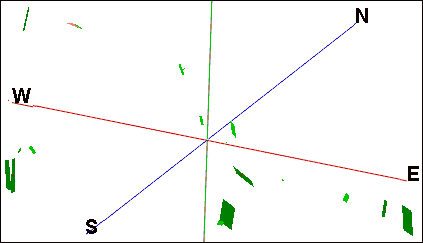
Subsequent Operations: The output from the Polylines -> Planes program may be directly processed by the following programs:
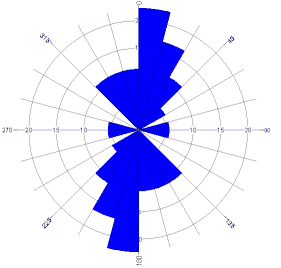
Sample output from DirStat / Rose program.
- Planes | Stereonet Diagram:
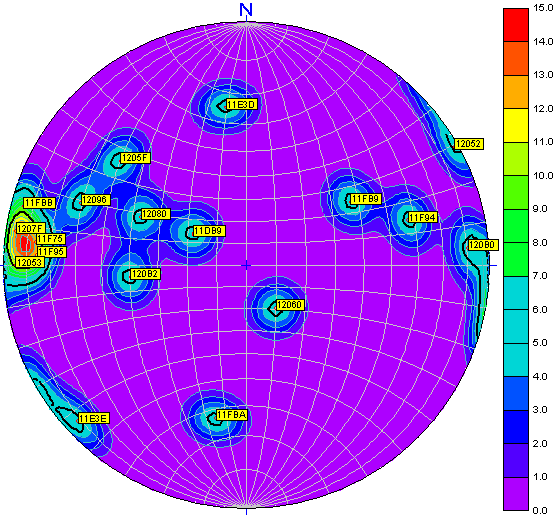
Sample output from DirStat / Stereonet program. Note labels depicting polyline titles.
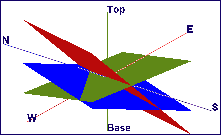
- Grafix | 3D Utilities | Triangles:
Sample output from OpenGL / Triangles program.
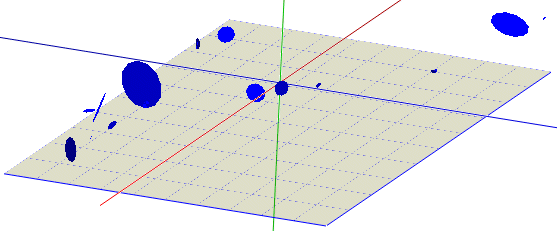
Sample output from OpenGL / Discs program.
This example was created by gridding three of the output files that were generated by the "Save Projected Points" option.
 Back to Planes Menu Summary

RockWare home page