RockWorks | Borehole Manager | P-Data |
Analyze | P-Data -> Lithology | Create Predictive Model
Use this program to create a scattergram (crossplot) and a predictive model for lithology using two P-Data tracks. The basic idea is to look at "calibration" holes in which the lithology is known, look for correlations between the p-data for two datasets (e.g. gamma and resistivity) and lithology, and then create a "predictive model". This, then, allows the "Apply Predictive Model" program (the other sub-option under P-Data | Analyze | P-Data -> Lithology) to predict lithologies based on the relationships between the p-data and the lithology for the calibration holes.
Click here for a detailed example.
Feature Level: RockWorks Standard and higher
Menu Options
Step-by-Step Summary
Menu Options
- P-Data Track #1: Click to the right to select the name of one of the existing P-Data columns that contains the measurements to be analyzed.
- P-Data Track #2: Click to the right to select the name of the second P-Data columns to be analyzed.
- Lithology Types: Click here to view the existing Lithology Types Table in the current project.
! RockWorks will only analyze those lithology types with check-marks in their "Show in Legend" column. If you know that you have some materials listed here that are not present in the borehole database, you can select the Edit | Turn off Unused Lithology option in the Lithology Types table to activate only those lithotypes currently represented.
- Predictive Lithology Model: Click here to type in a name to assign to the grid model (.RwGrd) that will be generated, containing the predictive model.
- Annotation / Symbol Dimensions: Expand this heading to establish the size for the scatterplot symbols and adjust the pattern density.
- Choose from Small, Medium, or Large, or click in the Other radio button and type in the preferred size (as a percent of the project size)
- Pattern Density Multiplier: Lithology patterns (as established in the Lithology Types table) are displayed in the square symbols used in the scatterplot and they can be displayed in the predictive model's map. This Multiplier setting can be used to change the size of the pattern designs: denser so that they will be visible inside the small symbols or less dense in the predictive map. A setting of "1" will use the pattern density currently set in the Lithology Types table. A setting of "0.5" will make the patterns twice as dense. A setting of "2" will make the patterns half as dense.
- Show Control Points: Check this box to display the scatterplot points.
- Show Predictive Model: Check this box to display the interpolated model in a graphic format. You can choose both the points and the model, or either alone. Note that even if you don't display the model graphically, the predictive lithology model will still be created.
- Cell Style:
- Background Color Only: Choose this radio button if only the background color established in the Lithology Types table is to be used to fill the scatterplot symbols.
- Background Colors w/ Patterns: Choose this radio button if both the colors and patterns shown in the Lithology Types table are to be used to fill the scatterplot symbols.
- Include Cell Borders: Check this box to include the grid cell boundaries within the predictive model map.
- Diagram Dimensions:
- Width: Enter the width, in inches, for the scattergram plot.
- Height: Enter the height, in inches, for the scattergram plot.
Step-by-Step Summary
- Access the RockWorks Borehole Manager program tab.
- Disable the boreholes that do not contain any lithology entries by removing checks from the boxes next to their names.
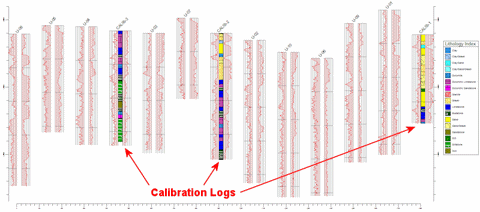
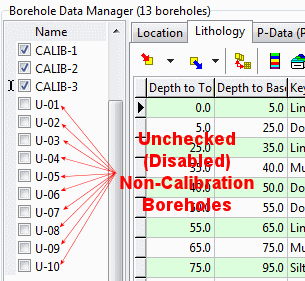
- Be sure that the active boreholes (here called "calibration holes"), which do contain lithology, also contain data in the two P-Data tracks that are to be analyzed. If any of these calibration holes are missing either or both P-Data tracks, disable them also.
- Activate the lithology types to be processed by inserting/removing checks from the Lithology Types table's Plot in Legend check-box. (You can also access the Lithology Types table from within this program's Options window.)
- Select the P-Data | Analyze | P-Data -> Lithology | Create Predictive Model menu option.
- Establish the desired menu settings, as discussed above.
- Click the Process button to proceed with diagram generation.
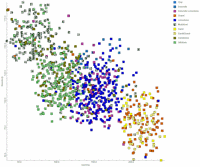
The program will read the contents of the input P-Data tracks for each calibration borehole and determine the corresponding lithology material at each measurement location. It will build a scatterplot with P-Data Track 1 along the horizontal axis and P-Data Track 2 along the vertical axis. Each point will be represented on the scatterplot with a pattern/color-filled square that corresponds to the lithology type. If you've requested that this be displayed, it will appear in the Plot pane of the Options window.
The program will then interpolate a grid model of this XY scattergram, whose node values are estimated by counting the occurrences of each lithology type at the node. Undefined nodes are interpolated using a "closest-point" algorithm. The model will be stored under the indicated .RwGrd file name, and can later function as the "lookup table" for predicting the lithology for logs that do not include lithology. If you've requested that the Predictive Model be displayed, it will appear in a RockPlot2D tab in the Options window.
In addition the Prediction Accuracy Report will be displayed in a text tab in the Options window.
- You can adjust any of the settings in the pane to the left and then click the Process button again to regenerate the scatterplot and the report.
! Each time you click the Process button, the existing display will be replaced.
- View / save / manipulate / print / export the image in the RockPlot2D window.
- ! LOOK AT THE REPORT. This is important. If it appears that this data set shows that the p-data combination correlates well with the lithology types for the calibration wells, then you can proceed to next step of applying the predictive model. If the results of the Prediction Accuracy Report are unsatisfactory, you should not proceed to the next step.
 Back to P-Data Menu Summary

RockWare home page