RockWorks | Utilities | Grafix | 3D-Utilities | Tubes
This program reads X1 Y1 Z1, X2 Y2 Z2 coordinates from the Utilities data sheet, and displays these as oriented tubes in the RockPlot3D window.
Menu Options
Step-by-Step Summary
Menu Options
- Input Columns: The prompts along the left side of the window tell RockWorks which columns in the input datasheet contain what data.
Click on a displayed name to select a different name from the drop-down list.
- ID: Click on this item to select the name of the column in the current datasheet that lists the names or ID's of the tubes, if any.
These will simply be used to label the objects in the data tree within RockPlot3D.
- Color: Click on this item to select the name of the datasheet column that contains the tube colors.
- X1: Click on the X1 item to select the name of the datasheet column that contains the X or Easting coordinate for one end of the tube.
Be sure you've defined the coordinate system and units for the X and Y columns.
- Y1: Click on the Y1 item to select the name of the datasheet column that contains the Y or Northing coordinate for one end of the tube
- Z1: Click here to select the name of the datasheet column that contains the Z or elevation coordinate for one end of the tube.
Be sure you've defined the vertical units for the elevation columns.
- X2: Click on the X2 item to select the name of the datasheet column that contains the X or Easting coordinate for the other end of the tube.
- Y2: Click here to select the name of the datasheet column that contains the Y or Northing coordinate for the other end of the tube.
- Z2: Click here to select the name of the datasheet column that contains the Z or elevation coordinate for the other end of the tube.
- Radius: Click here to select the name of the column that contains the radius for each tube in feet or meters.
- Group Name: Click on this item to type in a name for the tubes' group in RockPlot3D. For example, if the objects represent mine workings, you could enter "Mine Workings".
- Reference cage: Insert a check here to include boundary lines and coordinate labels. (More.)
Step-by-Step Summary
- Access the RockWorks Utilities program tab.
- Create a new datasheet and enter or import your listing of XYZ tube coordinates into the datasheet.
Or, open one of the sample files and replace that data with your own. (Sample file = "\RockWorks17 Data\Samples\Tubes_01.rwDat".) See 3D Tubes Data format for details.
- Select the Grafix | 3D-Utilities | Tubes menu option.
- Establish the requested menu settings, described above.
- Click the Process button to continue.
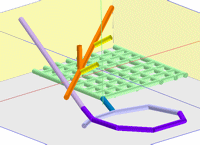
The program will read the indicated pipe coordinates and create a 3D diagram that displays their placement using the indicated width and color. The completed diagram will be displayed in a a RockPlot3D tab in the options window.
- You can adjust any of the diagram options in the pane to the left and then click the Process button again to regenerate the 3D image.
! Each time you click the Process button, the existing display will be replaced.
- View / manipulate the image in RockPlot3D.
 Back to Grafix Menu Summary

RockWare home page