RockWorks | Borehole Manager | I-Data | Statistics
This program is used to calculate statistics for a single column of I-Data measurements in the current project, for all enabled boreholes. This can be a handy way to get a quick look at the range and distribution of values prior to, or after, modeling. This is the same tool that is present in the Utilities | Statistics | Univariate menu.
Feature Level: RockWorks Standard and higher
Menu Options
Step-by-Step Summary
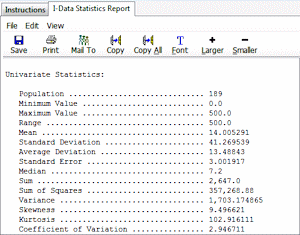
The program will read the selected track of data for the enabled boreholes, apply any requested filtering operations, and then compute the general statistics. The statistical summary will be displayed in a Text tab in the Options window.
From here you can print the information, copy it to the clipboard for pasting into another application, save the information on disk, etc.
The results will include the following calculated statistics:
- Population: The number of values the program found for the selected data which fell within the specified filtering range and which were included in the statistics calculations.
- Minimum Value: The minimum value for the data included within the calculations.
- Maximum Value: The maximum value for the data included within the calculations.
- Mean: The arithmetic average of the sample data, equaling the sum of the values divided by the number of measurements.
- Standard Deviation: A measurement that indicates the way in which the data is centered around its mean, equal to the positive square root of the variance of the sample.
- Standard Error: A measurement that indicates the variability that can be expected in the means computed for samples taken randomly from the same population.
- Median: The value that is in the middle of the frequency distribution of the data.
- Sum: The total of all data included within the calculations added together.
- Square Root of Sum: The arithmetic square root of the total of all data included within the calculations added together.
- Sum Squared: The value of the total of all data included within the calculations added together and multiplied by itself.
- Variance: The measured degree of difference between all data included within the calculations.
- Deleted Points: The number of measurements that were excluded from the calculations because they fell outside a specified filtering range.
- Statistical cutoff data, such as Mean + and - 1 Standard Deviation, 2 Standard Deviations, 3 Standard Deviations, and the populations represented within these groupings.
![]() Back to I-Data Menu Summary
Back to I-Data Menu Summary
![]()