2D Faults are defined as line segments, either stand-alone or connected into multi-segmented "polylines", within a project database table. Each line segment is defined by an X,Y coordinate for the starting endpoint (X1, Y1) and an X,Y coordinate for the ending point (X2, Y2). The following example defines two multi-segmented polylines - note that the starting point for Pair 2 has the same coordinates as the ending point for Pair 1.

Each Fault Table can contain any number of individual and polyline segments.
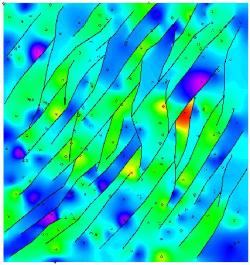
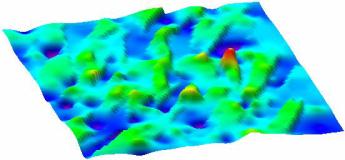
Complex 2D Faulting with the faulted surface displayed in 2D (above) and 3D (below)
A 2D Fault Table can be created in several ways:
- By typing the coordinate pairs into a Fault Table in the project database.
- By drawing the lines/polylines onto a map displayed in RockPlot2D, and copying them to the Fault Table (see following example).
Step-by-Step Fault Example:
-
We begin by creating a unfaulted grid model and diagram by using the RockWorks | Utilities | Map | Grid-Based Map program.
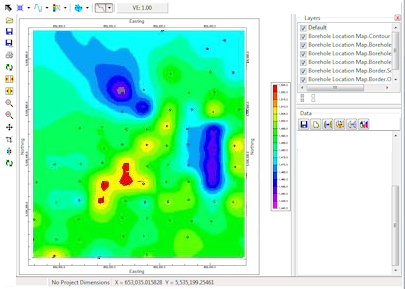
Unfaulted grid model and diagram displayed within the RockPlot/2D program.
-
Next, we select the Draw | Polyline tool in RockPlot2D and draw, on-screen, the interpreted fault traces.
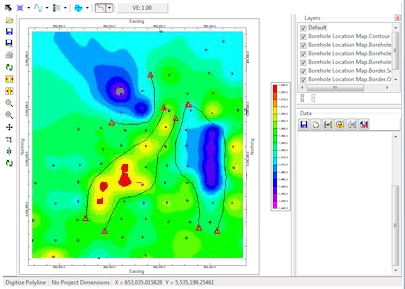
Polylines drawn on-screen using the Draw | Polyline tool within the RockPlot2D program.
- When you've drawn all of the lines, select the Edit Mode button
 in the RockPlot2D toolbar, and select all of the lines: Click on the one polyline, hold down the Shift key and click on another polyline, and so on. If an item is selected, you'll see handles on its vertices.
- When all of the lines are selected, right-click on the last line selected, and choose the Save to Faults Table option in the pop-up menu.
- Enter a name for this new table and click OK. You should be descriptive with your names for future identification. (You can maintain multiple Fault Tables in a project database.)
! If a Fault Table by that name already exists, its contents will be replaced by this new polyline information.
- Now, you'll need to recreate the grid model, with the faulting option activated. Return to the map options in the left pane of the window, and make the following changes to the menu settings:
- In the Gridding Options window, activate the "Faulted" option within the Additional Options pane to the right. (Not all gridding methods support faulting.)
- Select the name of the Fault Table you just created.
- Set the Distance Multiplier to 10 (i.e. multiply point-to-node distances on opposite sides of fault segments by 10) thereby making their effect miniscule (i.e. treat the faults as "opaque" boundaries).
- Insert a check in the Fault Polylines option under the 2-Dimensional diagram options.
- Click the Process button to reinterpolate the grid model, and regenerate the map.
The new map should look something like the following:
Map representing faulted grid model.
Notice how the distance multiplier can be used to adjust the "transparency" of the faults. This can be a useful tool when simulating drag along a fault.
NOTE: This faulting capability can also be used to simulate non-fault discontinuities such as erosional and excavation escarpments.
Topographic Model Using Fault Capability To Depict Excavation Breakpoints
See also: Creating 3D Fault Files - Single Faults, Creating 3D Fault Files - Multiple Faults
Back to Fault Tables

RockWare home page