RockWorks | Utilities | Grid |
Grids -> Stratigraphic Fence
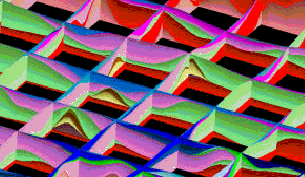
This program is used to create a stratigraphic fence diagram based on a list of existing grid models that represent the top ("superface") and base ("subface") of each unit. These are grid models that must already exist on your computer. You may request regular fence panel spacing, in a variety of configurations, or you can draw your own panels.
This program is designed for two types of applications:
- Users who have created their grid models within other applications (e.g. ModFlow, Surfer) and wish to use RockWorks to create stratigraphic (or hydrostratigraphic) fence diagrams.
- Users who have created their grid models within the Borehole Manager portion of RockWorks but need more flexibility in dealing with stratigraphic relationships (e.g. special manipulations with the grids).
This is a "manual" way of creating the kind of stratigraphic fence that’s available in the Borehole Manager's Stratigraphy | Fence tool.
Menu Options
Step-by-Step Summary
Menu Options
- Specify the Input Column information in the left pane of the window:
- Title: Select the name of the column in the datasheet that lists the formation title as it will be displayed in RockPlot3D.
- Superface: Select the name of the column in the datasheet that lists the names of the grid files (.RwGrd) that represent each unit’s upper surface.
- Subface: Select the name of the column in the datasheet that lists the name of the grid files (.RwGrd) that represent each unit’s lower surface.
- Color: Select the name of the column in the datasheet that displays the color in which the unit is to be represented in the stratigraphic fence.
- Cutoff: This setting is used only for stratigraphic models, not fences. The setting established here will be ignored.
- Smoothing Passes: Use this to define how many times the stratigraphic contacts should be smoothed. Enter "0" for no smoothing, "1" for slight smoothing, "2" for more smoothing, etc. Note that there is a paradox here: If you smooth the contacts, the diagrams will look more aesthetically pleasing, but the contacts may not exactly match up at intersection points between the panels.
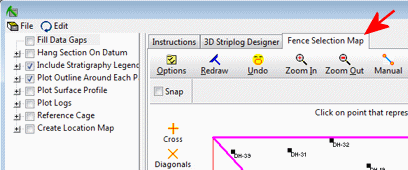
- Reference Cage: Insert a check here to include in the diagram a 3D frame with coordinates and elevation labels. (More.)
- Stratigraphy Legend: Insert a check in this item to include a legend that lists all of the formation names and their colors and patterns. The program will read this information from the project's Stratigraphy Type Table. Expand this item to set the legend width, size, and offset. (More.)
- Create Location Map: Insert a check here to have the program create, along with the fence diagram, a reference map that shows the fence panel locations. (More.)
-
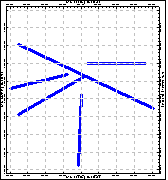
Fence Selection Map: Click on the Fence Selection Map tab to the right, to draw where the fence panels are to be placed. The most recent panels drawn for this project will be displayed. (More.)
! If you don't have boreholes in your project, there won't be any reference information in the selection map - just a rectangle defining the project dimensions. You may need to use pre-configured panels or import specific panel coordinates from a list.
Step-by-Step Summary
This program requires that two or more RockWorks-format grid models already exist.
- Access the RockWorks Utilities program tab.
- Open or create a "gridlist" data file that lists the names of the grid models (.RwGrd) representing the upper and lower surfaces of each unit, the titles for the units, and their color. The units should be listed with the lowest unit first, and the highest unit last.
- Select the Grid | Grids -> Stratigraphic Fence menu command.
- Enter the requested menu options, described above.
- Be sure to click on the Fence Selection Map tab to select the fence panel locations.
- Click the Process button to continue.
The program will layer the stratigraphic surfaces from the bottom up. It will look at the fence panel arrangements and slice the model at the requested locations. The completed diagram will be displayed in a RockPlot3D tab in the Options window.
- You can adjust any of the following items and then click the Process button again to regenerate the diagram.
- Fence diagram settings in the Options pane on the left, and/or
- Panel locations in the Fence Selection Map tab.
! Each time you click the Process button, the existing display will be replaced.
- View / save / manipulate / print / export the image in the RockPlot3D window.
 Back to Grid Menu Summary

RockWare home page