
RockWorks | Utilities | Grid | Grid -> Profile | Multiple
This program is used to create a single profile cut through multiple existing grid models, for display as a line profile diagram.
Menu Options
Step-by-Step Summary
Menu Options
- Input Columns: Use these prompts to define the names of the columns in the datasheet which contain the data to be read by the program.
- Grid File: Select the name of the column in the datasheet where the names of the grid files to be represented in the profile display are listed.
- Line Style: Select the name of the datasheet column where the line style for each grid's profile is listed.
- Smoothing: Click here to define the number of smoothing passes to apply to the profile lines. Enter 0 for no smoothing (if unsmoothed, the profile may have a stair-step appearance due to the cell-by-cell nature of a grid model).
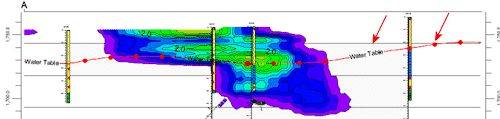
- Add Labels: Check this box to include labels along the polylines. See the graphic example below, in which the line is labeled "Water Table".
- Label Column: Click to the right to select the name of the column in the datasheet where the grid-specific labels are listed.
- Font color: Choose the text color by clicking on this box and selecting a color.
- Font Size: Type in the size for the label text characters, as a percent of the size of the project.
- Label Spacing: Use this prompt to enter the spacing for the text, as a percent of the project size.
- Opaque Background: Check this box if the text is to have an opaque background, and choose the fill color.
- Add Symbols: Check this box to include symbols along the surface profile polyline, as shown in this example (red symbols).
-
- Symbol Column: Click to the right to select the name of the column where the grid-specific symbols are listed.
- Symbol Size: Type into this prompt the size for the symbol, as a percent of the project size. (Default = 1.5)
- Symbol Spacing: Type into this prompt the spacing for the symbols, as a percent of the project size. (Default = 5.0)
- Create Additional Parallel Profiles: Check this box if you want multiple profile lines to be drawn automatically, offset from the profile that you define. Expand this heading to define the direction and spacing of the automatic profile lines, the maximum distance, and diagram labeling options. (More.)

- Show Fault(s): Check this box to display vertical fault lines in the profile, based on the location of one or more fault polylines defined in the project database. (More.)

- Perimeter Annotation Options: Click this button to establish title, border, and vertical exaggeration settings for the profile. (More.)
-
- Create Location Map: Insert a check here to have the program create, along with the profile, a reference map that shows the profile cut's location. It can be embedded in or created separately from the profile. (More.)
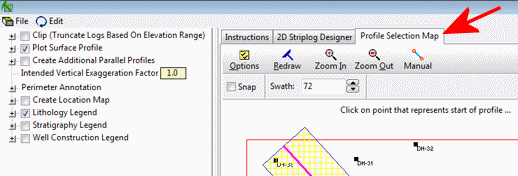
- Profile Selection Map: Click on the Profile Selection Map tab to the right, to select where the profile cut is to be placed. The most recent profile drawn for this project will be displayed. (More.)
! If you don't have boreholes in your project, there won't be any reference information in the selection map - just a rectangle defining the project dimensions. You may need to manually specify the panel coordinates.
Step-by-Step Summary
This program requires that the grid models to be illustrated as profiles already exist in the current project folder.
- Access the RockWorks Utilities program tab.
- Create a new datasheet and enter, import, copy-paste the listing of RwGrd files and line styles to be used to create the profile diagram. You can use the Columns | Column Properties menu option to define the column styles - file names, line styles, symbols, etc.
Or, open one of the sample files (e.g. "Grid_Profiles_01.RwDat") and replace that data with your own.
- Select the Grid | Grid(s) -> Profile | Multiple menu option.
- Enter the requested menu settings, described above.
- Be sure to click on the Profile Selection Map tab to set the profile location.
- Click the Process button to continue.
The program will look at the coordinates specified for the profile cut and determine the closest nodes along the cut in the input grid models. It will construct a vertical profile to illustrate the grid surface elevations, using the line styles you defined. The completed diagram will be displayed in a RockPlot2D tab in the Options window.
- You can adjust any of the profile options and then click the Process button again to regenerate the profile.
! Each time you click the Process button, the existing profile display will be replaced.
- View / save / manipulate / print / export the profile in the RockPlot2D window.
 Back to Grid Menu Summary

RockWare home page