RockWorks | Utilities | Grid | LIDAR XYZ -> Grid
This option is used to import XYZ files created from LIDAR (LIght Detection And Ranging) equipment and generate a grid model that represents the Z values (typically surface elevation).
This is different from the process of gridding external XYZ data in the Grid | Grid-Based Map option in these ways:
- Because of the huge number of points in a typical LIDAR file, the program does not load the points into memory (it's 100% file based).
- There is no choice for gridding algorithm - each grid node is assigned the Z-value for the last LIDAR point in that cell.
Menu Options
Step-by-Step Summary
Menu Options
- Input (ASCII XYZ) File: Click here to browse for the file that contains LIDAR points.
- Column Delimiter: Data within the input file may be either delimited by space or tab characters. Expand this heading and select the delimiting character.
- Input Columns: Click on each item to type in the relative position of the X (Easting), Y (Northing), and Z (Elevation) coordinates in the LIDAR file. For example, if the Z coordinates are listed in the 5th column in the input file, you would enter 5 for the Z-Column prompt.
- Grid File Name: Click on this item to type in the name of the file in which to store the grid model (.RwGrd file).
- Scan-For & Confirm Model Dimensions:
-
- Insert a check here to request that the program scan the external LIDAR xyz data file and suggest grid dimensions based on the default x-nodes and default y-nodes. This allows you to sidestep the process of attempting to import the data into the Utilities datasheet for subsequent scanning for project dimensions, which will either take too long or create a memory-overload failure.
-
- Default X-Nodes: Click here to type in the number of grid nodes to be generated along the west-east axis. You will be able to change this setting in the confirmation screen.
- Default Y-Nodes: Click here to type in the number of nodes to be generated along the south-north axis. As above, you will be able to change this setting in the confirmation screen.
- If you leave this option un-checked, the grid will be created at the current Output Dimensions settings. This can speed up the modeling process because the scanning step will be skipped, but you need to be sure the Output Dimensions are correctly established for the data.
- Create 2-Dimensional Grid Diagram: Insert a check in this check-box if you want to display the output grid as a 2D map at this time. Expand this heading to set up the 2D map layers (bitmap, symbols, labels, line contours, color-filled contours, labeled cells, and/or map border). Including symbols and labels is not recommended due to the huge number of LIDAR points.
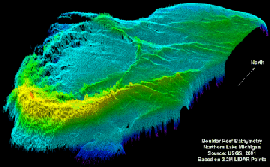
- Create 3-Dimensional Grid Diagram: Insert a check in this check-box if you want to display the output grid as a 3D surface. Expand this heading to set up the 3D map layers (flat surface, Boolean colors, perimeter, reference cage). You can request both a 2D and 3D representation of the grid model.
- Create Grid Statistics Report: Insert a check here if you want to see a report summarizing the output grid.
- Include Standard Deviation: Check this box if you want the report to include standard deviation.
- Include Directional Analysis: Check this box to include slope, aspect, and strike computations. Be warned that these can take a few moments for large grid models.
- Note: Very large grid models may produce out-of-memory errors within the RockPlot2D and RockPlot3D programs. Unfortunately, we cannot define the maximum model dimensions because it's based on a variety of variables (e.g. other programs that are currently loaded, RAM size, virtual memory size, etc.). The solution is to decrease the size of the grid or the node density.
Step-by-Step Summary
- Be sure you've got the source data ready. You'll need to know the location of the LIDAR XYZ file and the relative order of the X, Y, and Z columns in that file.
- Click on the Grid menu and choose the LIDAR XYZ -> Grid sub-option.
- Enter the requested menu settings, described above.
- Click the Process button when the grid and map options are established to your satisfaction.
The program will scan the file, if requested, for the minimum and maximum axis coordinates. It will display a summary window with the grid boundary coordinates and node spacing
- You may adjust the grid dimensions as necessary and click OK.
The program will create a new grid model from the LIDAR points, and if requested create a 2- or 3-dimensional image representing the grid model. The requested diagram(s) will be displayed in a RockPlot2D tab and/or RockPlot3D tab in the Options window. If you requested a statistics report, it will be displayed in a Text Tab in the Options window.
- You can adjust any of the settings in the Options window and then click the Process button again to regenerate the diagram(s).
! Each time you click the Process button, the existing display(s) will be replaced.
- View / save / manipulate / export / print the diagram in the RockPlot2D or RockPlot3D window.
 Back to Grid Menu Summary

RockWare home page