RockWorks | Utilities | Grid | Filters | Replace
For each XYZ point within the Utilities Datasheet, this program will locate the closest node within a grid file and replace its z-value with the z-value for the point within the datasheet. This can be a very handy way to "correct" grid models or even create grids based on imported XYZ points.
Menu Options
Step-by-Step Summary
Menu Options
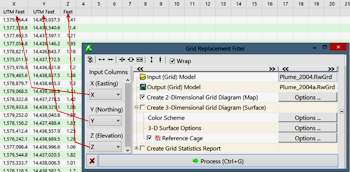
- Input Columns: Use these prompts to define the columns within the datasheet which contain the X and Y (location) coordinates and the Z value to be "pushed" into the grid model.
- X (Easting): Click here to select the name of the column containing the X or Easting coordinates.
- Y (Northing): Click here to select the name of the column containing the Y or Northing coordinates.
- Z (Elevation): Click here to select the name of the column containing the Z values (elevation, concentration, etc.) to replace node values in the existing grid.
- Input Grid Model: Click to the right to select the name of the existing grid file (.RwGrd) that the program is to read and filter.
- Output Grid Model: Click to the right to type in the name to assign to the new grid file that the program will create, which results from the replacement filtering operation.
- Create 2-Dimensional Grid Diagram: Insert a check in this check-box if you want to display the output grid as a 2D map at this time. Expand this heading to set up the 2D map layers (bitmap, symbols, labels, line contours, color-filled contours, labeled cells, and/or map border).
- Create 3-Dimensional Grid Diagram: Insert a check in this check-box if you want to display the output grid as a 3D surface. Expand this heading to set up the 3D map layers (flat surface, Boolean colors, perimeter, reference cage). You can request both a 2D and 3D representation of the grid model.
- Create Grid Statistics Report: Insert a check here if you want to see a report summarizing the output grid.
- Include Standard Deviation: Check this box if you want the report to include standard deviation.
- Include Directional Analysis: Check this box to include slope, aspect, and strike computations. Be warned that these can take a few moments for large grid models.
Step-by-Step Summary
- Be sure you have a RockWorks grid model (.RwGrd file) already created, for input into this program. See Initializing Grid Models if you need to create a new, blank grid.
- Access the RockWorks Utilities program tab.
- Open the .RwDat file that contains the XY point locations with the Z values to be used to replace the node values in the input grid.
- Select the Grid | Filters | Replace menu option.
- Enter the requested menu settings, described above.
- Click the Process button to continue.
The program will load the input grid file, locate the closest node to each XYZ point in the datasheet, and replace those nodes with the listed Z value. The resulting grid will be saved under the output grid file name.
The requested diagram(s) will be displayed in a RockPlot2D tab and/or RockPlot3D tab in the Options window. If you requested a statistics report, it will be displayed in a Text Tab in the Options window.
- You can adjust any of the settings in the Options window and then click the Process button again to regenerate the diagram(s).
! Each time you click the Process button, the existing display(s) will be replaced.
- View / save / manipulate / export / print the diagram in the RockPlot2D or RockPlot3D window.
 Back to Grid Menu Summary

RockWare home page