RockWorks | Utilities | Grid | Filters | Range
This program deletes high or low Z-values from a grid file, reassigning them a user-specified constant.
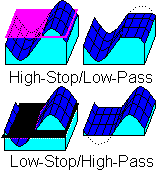
Examples: Using the High-Stop filter, you could set all Z values above a user-defined threshold to a constant to correct for outrageously anomalous values and generate more meaningful grid statistics. Using the Low-Stop filter, you could set contaminant values below a harmful limit to zero in order to highlight areas requiring remediation.
Menu Options
Step-by-Step Summary
Menu Options
- Input Columns: If you request plotting of 2D map symbols (below) AND if you have data loaded into the Utilities datasheet, you can use these prompts (along the left edge of the Options window) to specify the X and Y locations for the map symbols. If you don't plot map symbols, these will be ignored.
- X (Easting): Click here to select the name of the column containing the X or Easting coordinates.
- Y (Northing): Click here to select the name of the column containing the Y or Northing coordinates.
- Input Grid Model: Click to the right to select the name of the existing grid file (.RwGrd) that the program is to read and filter.
- Output Grid Model: Click to the right to type in the name to assign to the new grid file that the program will create, which results from the range filtering operation.
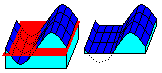
- High-Stop / Low-Pass Filter: Insert a check here if you want to filter out high Z-values from the input grid file, passing all lower node values.
- Threshold: Enter the maximum acceptable node value in the input grid file.
- Replacement Value: Enter the value to replace those nodes whose Z values exceed the Threshold. This can be, but is not required to be, equal the Threshold.

- Low-Stop / High-Pass Filtering: Insert a check here if you want to filter out low Z-values from the input grid file, passing all greater node values. You may activate both filters.
- Threshold: Enter the minimum acceptable node value in the input grid file.
- Replacement Value: Enter the value to replace those nodes whose Z values fall below the Threshold. This can be, but is not required to be, equal the Threshold.
- Create 2-Dimensional Grid Diagram: Insert a check in this check-box if you want to display the output grid as a 2D map at this time. Expand this heading to set up the 2D map layers (bitmap, symbols, labels, line contours, color-filled contours, labeled cells, and/or map border).
- Create 3-Dimensional Grid Diagram: Insert a check in this check-box if you want to display the output grid as a 3D surface. Expand this heading to set up the 3D map layers (flat surface, Boolean colors, perimeter, reference cage). You can request both a 2D and 3D representation of the grid model.
- Create Grid Statistics Report: Insert a check here if you want to see a report summarizing the output grid.
- Include Standard Deviation: Check this box if you want the report to include standard deviation.
- Include Directional Analysis: Check this box to include slope, aspect, and strike computations. Be warned that these can take a few moments for large grid models.
Step-by-Step Summary
- Be sure you have a RockWorks grid model (.RwGrd file) already created, for input into this program.
- Access the RockWorks Utilities program tab so that you can see the Grid menu commands.
- If you'll be creating a 2D map with sample location (well) symbols, you can use the File | Open option to open the .RwDat file containing the X and Y location coordinates for the map symbols.
- Select the Grid | Filters | Range menu option.
- Enter the requested menu settings, described above.
- Click the Process button to continue.
The program will load the input grid file, compare each grid node Z-value to the declared filter range(s), change node values or pass node values unchanged as appropriate, and store the results on disk under the output grid file name.
The requested diagram(s) will be displayed in a RockPlot2D tab and/or RockPlot3D tab in the Options window. If you requested a statistics report, it will be displayed in a Text Tab in the Options window.
- You can adjust any of the settings in the Options window and then click the Process button again to regenerate the diagram(s).
! Each time you click the Process button, the existing display(s) will be replaced.
- View / save / manipulate / export / print the diagram in the RockPlot2D or RockPlot3D window.
 Back to Grid Menu Summary

RockWare home page