RockWorks | Utilities | Grid | Fence
This program will plot three-dimensional profiles based on an existing grid model (i.e. the intersection between the ground surface and the fence panels). In order to improve the appearance of these profiles, they are plotted as three-dimensional tubes. These profile tubes can be combined with fence panels constructed elsewhere in the program.
Menu Options
Step-by-Step Summary
Menu Options
- Grid Model: Click on this item to brows for the name of the existing grid model (.RwGrd file) that is to be represented as a profile line in the fence panels. This grid model must already exist in your project folder. Some examples: If you have created a surface contour map of the borehole locations (Borehole Manager | Map | Borehole Locations) you could use that surface grid model as the source of the profile line in a lithology, stratigraphy, P-Data, I-Data, or other fence diagram. Or, if you have imported digital elevation data in the form of a grid model, you could use that as the source for the profile line.
- Profile:
- Color: Color to be used when plotting the 3D tubes that depict the surface profile.
- Radius: Radius (in percentage units) to be used when plotting profiles.
- Smoothing: If set to zero, the profile will have a "stair-step" appearance that is caused by the discrete nature of the grid model.
- Vertical Lines at Endpoints: If desired, vertical lines can be plotted along the edges of the fence panels. The elevation at the base of these lines is defined by the Base Elevation (see below).
- Color: Color to be used when plotting vertical edge lines.
- Radius: Radius (in percentage units) to be used when plotting vertical edge lines.
- Horizontal Line along Base: If desired, a horizontal line can be plotted along the base of each fence panel. The elevation for this line is defined by the Base Elevation (see below).
- Color: Color to be used when plotting horizontal base line.
- Radius: Radius (in percentage units) to be used when plotting horizontal base line.
- Base Elevation: The elevation that is used for plotting the vertical edges and the base can be defined in one of two ways:
- Based On Project Dimensions: The base elevation will be defined by the minimum z coordinate that is specified within the project dimensions menu.
- Manually Specified: The base elevation will be defined by the following setting.
- Elevation: Elevation at which base line will be plotted.
- Create Location Map: Insert a check here to have the program create, along with the fence diagram, a reference map that shows the fence panel locations. (More.)
-
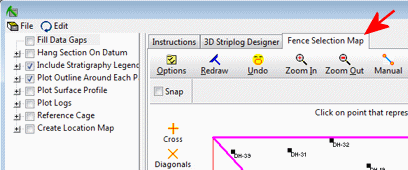
Fence Selection Map: Click on the Fence Selection Map tab to the right, to draw where the fence panels are to be placed. The most recent panels drawn for this project will be displayed. (More.)
! If you don't have boreholes in your project, there won't be any reference information in the selection map - just a rectangle defining the project dimensions. You may need to use pre-configured panels or import specific panel coordinates from a list.
Step-by-Step Summary
This program requires that the grid model to be illustrated as a 3D profile (fence) already exists in the current project folder.
- Access the RockWorks | Utilities program tab.
- Select the Grid | Grid -> Fence menu option.
- Enter the requested menu settings, described above.
- Be sure to click on the Fence Selection Map tab to select the fence panel locations.
- Click the Proceed button to continue.
The program will look at the coordinates specified for the fence panels and determine the closest nodes along the slices in the input grid model. It will construct a vertical profile for each panel to illustrate the grid surface elevations, using the line style you selected. The completed diagram will be displayed in a RockPlot3D tab in the Options window.
- You can adjust any of the following items and then click the Process button again to regenerate the diagram.
- Fence diagram settings in the Options pane on the left, and/or
- Panel locations in the Fence Selection Map tab.
! Each time you click the Process button, the existing display will be replaced.
- View / save / manipulate / print / export the image in the RockPlot3D window.
 Back to Grid Menu Summary

RockWare home page