RockWorks | Utilities | EarthApps | Polygons | PLSS (Public Land Survey System) Grid
This program:
- Reads user-input menu settings.
- Creates a KML output file which displays the selected Ranges and Townships, based on the RockWare Landbase. The map lines and labels will be clamped to the ground.
- Creates a KMZ (zip) output file, containing the KML file.
- Loads the KMZ file in Google Earth.
! This tool requires that you have downloaded the free RockWorks Landbase. See the Landbase Overview for a discussion and for coverage maps and tables.
Menu Options
Step-by-Step Summary
Menu Options
- Map Extents Defined By... Expand this heading to tell the program how big to make your map.
- Borehole Project Dimensions (Slow): Choose this option if you want to create a section map for the entirety of your project, across the coordinate extents established in the Output Dimensions tab.
! Because this option requires that the program scan the entire LandBase library, this can be very slow.
!Don't choose this option if you are licensed for the EarthApps only.
- Min/Max Longitude & Latitude (Slow): Choose this option if you wish to enter the longitude and latitude coordinates, in decimal degrees, for the map edges.
! Because this option requires that the program scan the entire LandBase library, this can be very slow.
- Western Border (Min Longitude): Click to the right to type in the decimal longitude coordinate for the western edge of the section map.
- Eastern Border (Max Longitude): Click to the right to type in the decimal longitude coordinate for the eastern edge of the section map.
- Southern Border (Min Latitude): Click to the right to type in the decimal latitude coordinate for the southern edge of the section map.
- Northern Border (Max Latitude): Click to the right to type in the decimal latitude coordinate for the northern edge of the section map.
-
- Range and Township (Fast): Choose this option if you want to create the section map for a specific Range and Township listing. Expand this heading as necessary to establish the Range and Township extents for the map to be created. Partial Townships are not allowed.
! Please refer to the Landbase Overview for more information about what areas are covered in the land grid database.
- Principal Meridian: The current meridian will be displayed to the right. Click on the displayed value to change it - you'll see a map of the U.S. Select the BLM zone in which you are working by clicking in the appropriate radio button. This setting is important in order to define the correct placement of the Range and Township data.
- Ranges: Expand this heading to select the Ranges to be included in the map.
- Westernmost Range: Click here to type in the number for the westernmost Range to be included in the map. You need to be sure to enter a number and a letter, as in "6W" or "R6W", or as in "3E" or R3E". You can also note western Ranges simply with a negative sign, as in "-6" and eastern Ranges with a positive sign, as in "3"
- Easternmost Range: Click here to type in the number for the easternmost Range to be included in the map. As above, you need to enter a number and a letter, as in ""6W" or "R6W", or as in "3E" or R3E". You can also note western Ranges simply with a negative sign, as in "-6" and eastern Ranges with a positive sign, as in "3.0"
- Townships: Expand this heading to select the Townships to be included in the map.
- Southernmost Township: Click here to type in the number for the southernmost Township to be included in the map. You need to be sure to enter a number and a letter, as in "13S" or "T13S", or as in "5N" or T5N". You can also note Southern Townships simply with a negative sign, as in "-13" and Northern Townships with a positive sign, as in "5"
- Northernmost Township: Click here to type in the number for the northernmost Township to be included in the map. As above, you need to enter a number and a letter, as in "13S" or "T13S", or as in "5N" or T5N". You can also note southern Townships simply with a negative sign, as in "-13" and northern Townships with a positive sign, as in "5"
- Map Options: Use these settings to define how the section map will look.
- Section Borders: Insert a check in this box to draw the section border lines.
- Color: Click on the color box to the right to choose a color for the section border lines.
- Thickness: Defines the thickness for the section lines in pixels. Click on the displayed value to type in a preferred pixel thickness.
- Fill Sections: Insert a check here if the section polygons should include a fill color. Expand this heading to establish the fill options.
- Color: Expand this heading to select the color options.
- Fixed: Choose this for uniform fill.
- Fixed Color: Click to the right to choose the fill color for all of the section polygons.
- Random: Choose this option to have RockWorks randomly select fill colors.
- Opacity: Click to the right to type in an opacity percentage. Examples: "20" will be 20% opaque (80% transparent); "75" will be 75% opaque, 25% transparent.
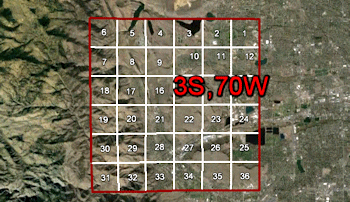
- Section Labels: Check this box to include labels inside each section to represent the section number.
! Note: Even if you omit section labels from the map, you'll be able to click on a section when it's displayed in Google Earth to see the Range, Township, and Section information.
- Color: Click on the color box to the right to choose the section label color.
- Size: This establishes the size of the section labels, as a percent of the diagonal size of the section. Default = 1.
Rule of thumb: 0.5 will create small labels, 2.0 large labels.
- Verbose: If checked, each section label will also include range and township number. If not checked, only the section number will display.
-

-
- Include Acreages: If checked, the computed acreage values will be listed in the labels below the Section number.
- Township Borders: Check this box to draw the township border lines.
- Color: Click on the color box to the right to choose a color for the township border lines.
- Thickness: Defines the thickness for the township lines in pixels. Click on the displayed value to type in a preferred pixel thickness.
- Fill Townships: Check this box to fill the township polygons with a solid color fill. Expand this heading to establish the fill options.
- Color: Expand this heading to select the color options.
- Fixed: Choose this for uniform fill for all polygons.
- Fixed Color: Click to the right to choose the fill color for all of the township polygons.
- Random: Choose this option to have RockWorks randomly select fill colors.
- Opacity: Click to the right to type in an opacity percentage. Examples: "20" will be 20% opaque (80% transparent); "75" will be 75% opaque, 25% transparent.
- Township Labels: Check this box to include map labels inside each township to represent the range and township number.
- Color: Click on the color box to the right to choose the township label color.
- Size: This establishes the size of the labels, as a percent of the diagonal size of the section. Default = 1.
Rule of thumb: 0.5 will create small labels, 2.0 large labels.
- Verbose: Check this box if the township labels should contain "R" and "T" in addition to the numbers and directions.
-
-
- Decimal Fractions: Check this box if the labels should include fractional township notations.
- Labeling Convention: Expand this to specify whether the Range or Township is listed first.
Step-by-Step Summary
- Access the Utilities program tab.
- You don't need to load any data into the datasheet for this program option, since it will pull the land grid information from the RockWare Landbase. See the Landbase Overview for download instructions.
- Select the Polygons | PLSS (Public Land Survey System) Grid menu option.
- Enter the menu options as described above.
- Click the Process button to continue.
The program will create a KML file containing the land grid lines, clamped to the ground. It will create a KMZ (zip) file containing the KML file. The Google Earth KML and KMZ file names will be assigned automatically.
- If RockWorks displays the KMZ name in a popup window for your reference, you can confirm:
- Automatically load file into Google Earth: Be sure this is checked if you want to display the output at this time.
- Show this message every time a KMZ File is Created: If checked, this window will be displayed each time a Google Earth output is created. Uncheck this if you prefer not to see this window in the future.
(Both of these settings are also available via the Preferences menu.)
- Click OK to continue or Cancel to cancel the operation.
The resulting map will be displayed in Google Earth, if requested.
 Back to Polygon Maps Summary
"Google" is a trademark of Google Inc.

RockWare home page