RockWorks | Utilities | EarthApps | Lines | Tubes Menu
Use the programs in the Utilities | EarthApps | Lines | Tubes menu to read line segment endpoints from the Datasheet Editor and plot these 3D tube segments in Google Earth.
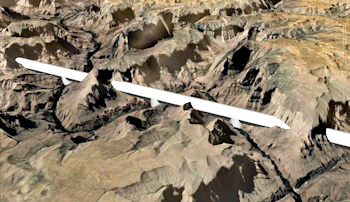
Simple: Tubes are plotted between the X1Y1Z1, X2Y2Z2 endpoints using a fixed color and radius, either clamped to the ground, relative to the ground, or using absolute elevations.
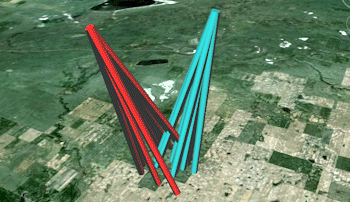
Advanced: Tube segments are drawn between the X1Y1Z1, X2Y2Z2 endpoints using variable colors and radii, with the tubes plotted either along the ground, relative to the ground, or at a fixed elevation.
![]() Back to EarthApps Summary
Back to EarthApps Summary
"Google" is a trademark of Google Inc.
![]()