RockWorks | Utilities | EarthApps | Lines | Lines Menu
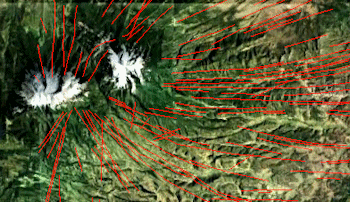
Use the programs in the Utilities | EarthApps | Lines menu to read line segment endpoints from the Datasheet Editor and plot these line segments in Google Earth in 2D or 3D.
2D (Simple): Lines are plotted between the X1Y1, X2Y2 endpoints in a constant color and thickness, clamped to the ground.
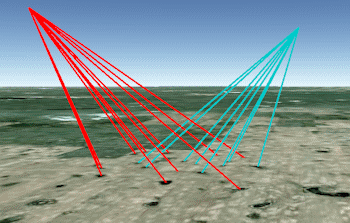
3D (Simple): Line segments drawn between X1Y1Z1, X2Y2Z2 endpoints in a constant color and thickness, with the lines plotted at absolute or relative elevations.
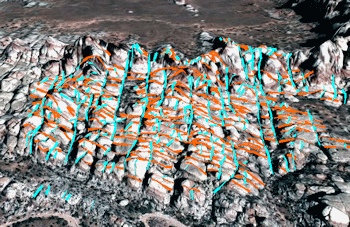
2D/3D (Advanced): Line segments are drawn between the X1Y1, X2Y2 endpoints using fixed or variable colors and thicknesses, with the lines plotted along the ground, relative to the ground, or at a fixed elevation. Lines can be "extruded" down to the ground like fence panels.
![]() Back to EarthApps Summary
Back to EarthApps Summary
"Google" is a trademark of Google Inc.
![]()