RockWorks | Utilities | Hydrology | Drawdown Calculator
This program is used to calculate water-level drawdown for a single well using the Theis non-equilibrium equation. Data for a single well is entered directly into the program dialog box; it is not read from the program datasheet. The program will display computed drawdown numbers at user-selected distance increments and in a simple drawdown diagram.
Menu Options
Step-by-Step Summary
- Well Parameters:
- Labeled Axes: Insert a check here to include labels along the diagram axes. Click on this tab to access the label settings. (More info)
- Output Table
Click this tab to define the output format(s) for the report. (More info)
- RwDat (RockWorks): Click in this button if you want the report generated in a RockWorks datasheet (.RwDat) format.
- CSV (Excel): Click in this button if you want the report generated in a CSV file format for use in Excel.
- TXT (Notepad): Click in this button if you want the report generated in a text (.txt) format.
- RTF (Word): Click in this button if you want the report generated in an RTF file format for use in Word.
- Output Options
- Save Output File: Check this to assign a name for the map in advance, rather than displaying it as Untitled.
- Automatic: Choose this option to have RockWorks assign the name automatically. It will use the name of the current program plus a numeric suffix, plus the ".Rw2D" file name extension.
- Manual: Choose this option to type in a name of your own for this file.
- Display Output: Check this option to have the resulting map displayed in RockPlot2D once it is created.
This program does not require that any data be listed in the RockWorks datasheet. It reads data input into the program window itself.
- Select the Utilities | Hydrology | Drawdown Calculator menu option.
- Enter the requested data, listed above.
- To compute the drawdown for the entered data, click on the Continue button.
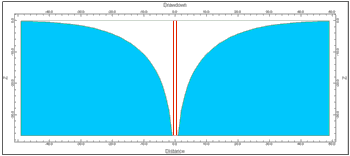
RockWorks will perform the drawdown calculation. It will list the drawdown for the indicated distance increments in the output option(s) you requested.
It will also create a diagram to illustrate this (using any border annotation settings you establish), and display it in a RockPlot2D plotting tab.
- View / save / manipulate / print / export the diagram in the RockPlot2D window.
 Back to Hydrology Menu Summary

RockWare home page