![]() Time: 1 minute
Time: 1 minute
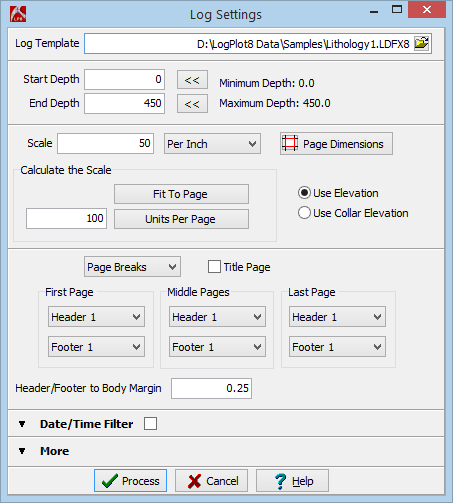
Log Template: This will default to the name of the file open in the Design tab.
Top of Interval, Bottom of Interval: These will be the top-to-bottom depth range for the log. They are extracted directly from the data files' BH Info datasheet. In your own work, this is where you can override the defaults to specify a subset of the entire log be created.
Scale: This determines how long the log will be. It represents the number of depth units output per inch (or cm) on the compiled log.
For this log, be sure the Scale is set to 50 and the units are per Inch.
Page Breaks: Choose this option. This tells LogPlot to plot a header and footer on each page if your log has multiple pages.
Headers/Footers: Select the options shown in the example above.
Click here for a more detailed explanation of the compile window.
LogPlot will:
The Log View window is used to display compiled logs, save them on disk, export them, and print them.
Tip: In your own work, you can quick-compile one or more data files using the Project Manager: Ctrl+click on multiple data file names, then right-click, and choose Compile Selected Data Files.

![]() Back to menu | Next (View, Save, and Export the Log)
Back to menu | Next (View, Save, and Export the Log) ![]()
![]()