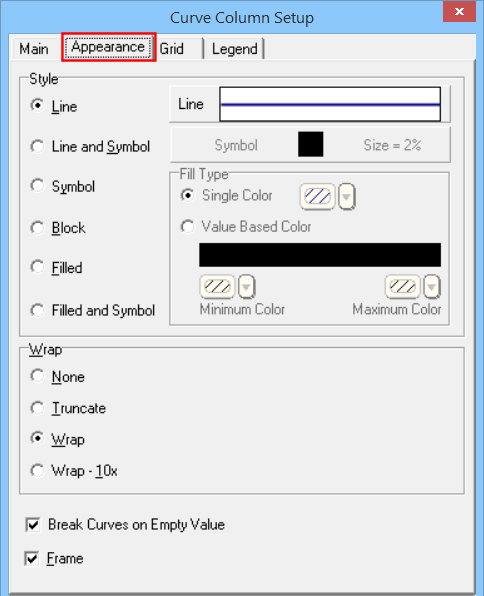
Use the settings on the Appearance tab of the Curve Column Setup window to define a variety of settings that control the appearance of the curve and curve column.
Line: Click on this large button to select the style, thickness and color for the curve line. You may select this information even if you wish to fill the curve with a solid color, below.
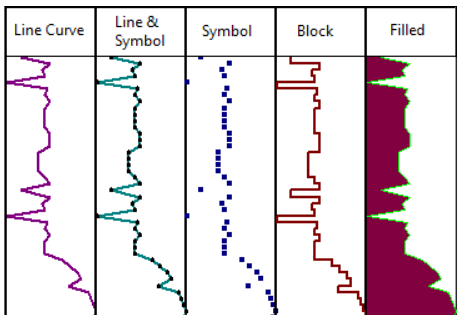
Curve Style: Select one of the options:
Line: With this option, the curve is plotted as a line, of the style and color selected above.
Line and Symbol: This option plots the curve as a line, using the style and color selected above. In addition, a symbol will be plotted at each data point listed in the source file. Selecting the symbol type is done using the Symbol button to the right (discussed below).
Symbol: This option plots a symbol at each data point in the curve column, with no line connecting the points. Selecting the symbol type is done using the Symbol button to the right (discussed below).
Block: This option transforms a point to point curve to a block curve, using the style and color selected above.
Filled: This option fills the curve with solid color. Click on the Color box to choose the color for the fill. This may be a different color than the Line color established above.
Compare these examples below.
Fill Type:
Single Color: Click in this button to fill the curve with a single, solid color. Click in the color box to select that color.
Value Based Color: Choose this option to create a gradient of color within the column. Use the color boxes to select a color for the minimum and maximum data values within the column.
Symbol: If you have requested a Curve Style that includes symbols, you can click on the Symbol example to select the symbol type and color.
Style: Select one of the symbol shapes and fills from the drop-down list at the top of the pop-up window.
Color: Choose a color for the curve symbols by clicking on the box and selecting a color.
Size: Choose Small, Medium, or Large, which represent percent of column width. If the pre-set sizes are too small or too large for your liking, you can select Other and enter a preferred percent value in the prompt box.
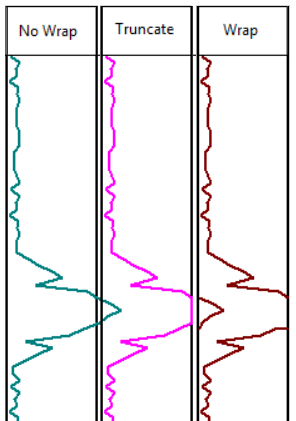
None: If this option is selected, the curve will be plotted beyond the boundary of the column if the data value exceeds the maximum value of the column.
Truncate: With this option, the curve plot will be truncated at the column border if the data value exceeds the maximum value of the column.
Wrap: This option will wrap the curve back to its baseline if the data value exceeds the maximum value of the column. When wrapped, the curve column then takes on the next data range for the plotting of the curve. If the wrapped data exceeds the maximum again, the program will continue to wrap to the baseline again.
Compare the following examples of a block curve, in which the high data values of 101-150 plot off the column (no wrap), are truncated, or are wrapped back to the midline:
Wrap 10x: This option functions like the Wrap, above, except that the wrapped portion of the curve is scaled to 1/10th the original scale. This can accommodate large data spikes without having to wrap multiple times.
For Wrap and Wrap 10x, curve values that are less than the column minimum will be truncated.
![]() Back to main topic
Back to main topic
![]()