![]() Time: 2 minutes
Time: 2 minutes
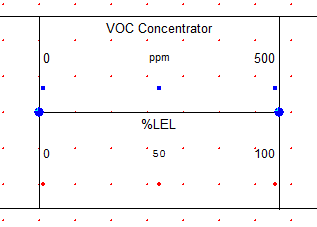
Now that you’ve moved the curves (and their header legends have followed), let's add a header line and label to tidy things up.
Insert the beginning endpoint of the line to the left of the VOC legend, hold down the left mouse button, and drag it downward to the bottom header line. Release the mouse button when the endpoint is lined up with the bottom of the header rectangle. You should then see the line in the display, with handles at the top and bottom.
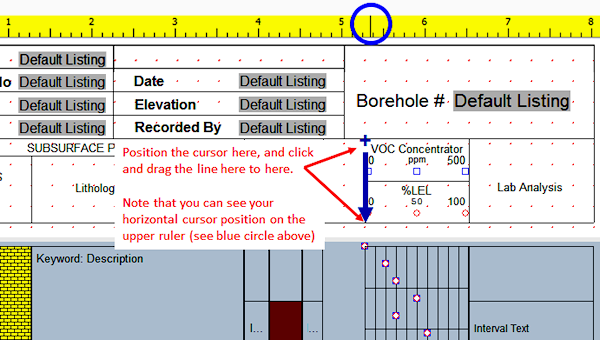
Use the horizontal scroll bar to scroll to the right. Use the Header 1 scroll bar to scroll down as necessary to see the line you just inserted.
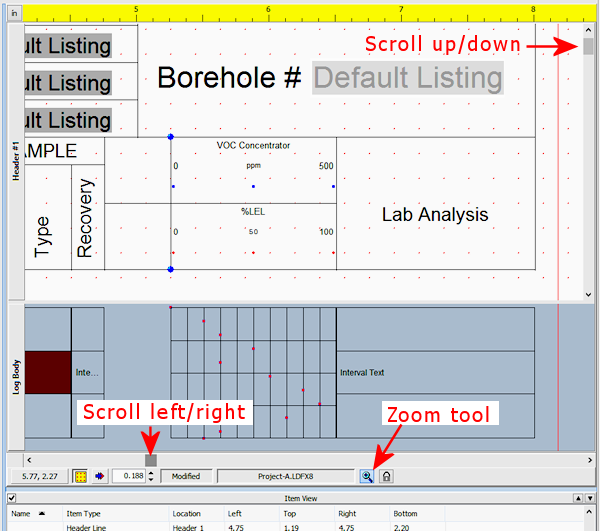
Click and hold either handle of the new line and drag the endpoint, as necessary, to line it up with the upper and lower horizontal lines. Release the mouse button to place the endpoint.
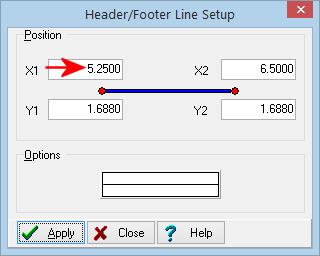
You can also double-click on the line to access its settings. You should be sure the X1 and X2 coordinates are set to 5.25 and the Y coordinates as shown below, so that they’ll line up with the log body columns. Click Apply to apply changes, and Close to close the window.
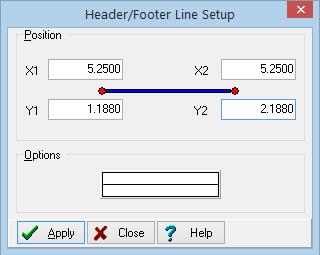
Or, you can double-click on that line to edit its placement via the Setup window. Click Apply to apply any changes, and Close to close the setup window.
Single-click on the "Recovery" label to the left of the line you just entered, so that it is selected. Choose Edit | Copy to make a copy of it, or right-click and choose Copy, or type Ctrl+C.
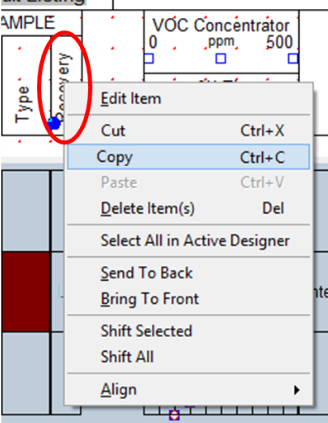
Then select Edit | Paste (or type Ctrl+V) to paste in a copy of this label.
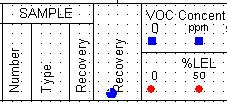
Drag the label to the blank space to the left of the curve legends.
Next, let's insert a Bar Graph column in the log body.
![]() Back to menu | Next ( Insert a bar graph column )
Back to menu | Next ( Insert a bar graph column ) ![]()
![]()