 Time: 2 minutes
Now that you have made some room, you can insert a Bar Graph column to display graphically the Recovery values.
- If you are still in Zoom mode from the previous lesson, click on the Zoom button (bottom of screen) to toggle it off.
- Click on the Log Body pane to make it active and display its design tools. Again, you can use the Visible Sections check-boxes to turn different panes on and off.
- Click on the Bar Graph button in the tool pane
 .
.
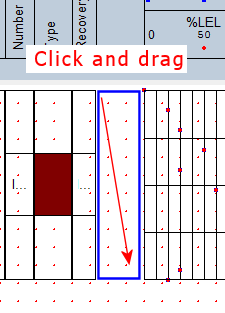
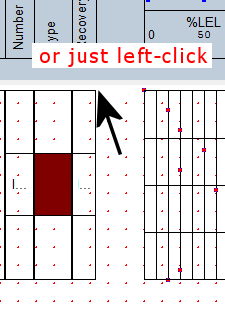
Position your mouse pointer in the Log Body pane and either (1) click-hold-drag to draw a rectangle in the avalable space, or (2) simply left-click within the space to place the column.
- Enter the requested settings for the Column:
Main Tab
- Name: Click on the down-arrow button to see the list of existing interval data-related entities in the design. Select the Recovery item. By sharing the name Recovery with the Interval Text column, they’ll also share the same data.
- Position: Left: Set the left edge to 4.75. Right: Set the right edge to 5.25.
- Scaling: Since the data values represent percent, you can set the scaling to Manual with the Min. Value at 0 and the Max. Value at 100. Choose the Low to High button. This means that the column will display values of zero along the left edge of the column and values of 100 along the right edge.
Appearance Tab
- Click on the Appearance tab. Column Border should be checked, Background Color not checked, and Bar Outline color to your choice. Set the Fill Type to a color and pattern of your choice, or to Value-Based colors with a starting color (for zero-values) and an ending color (for values of 100).
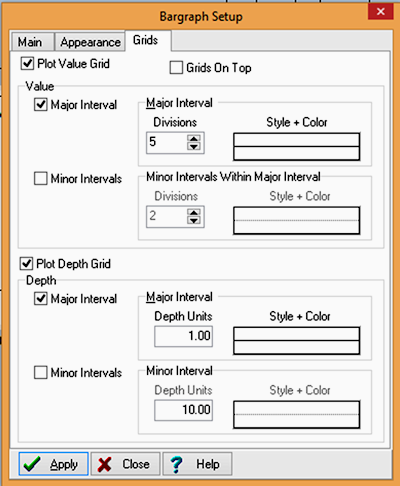
Grids Tab
- Click on the Grids tab and establish the following settings:
-
Click Apply at the bottom of the window, and then click Close.
- Save your changes by clicking the Save button
 .
.
Now let’s jump to entering data for this design.
 Back to menu | Next ( Enter data for this design )

RockWare home page