 Time: 3 minutes
Now that you have a new log design created, you have a few choices regarding getting your data into the program:
- Open the sample data file that "belongs" to the design you updated, and make necessary changes to the data.
- Create a blank data template based on the log design, using the Log Designer’s File | Create New Data File menu option. This blank file can be saved as a data template for later retrieval for other boreholes.
- Import data from another source (Excel, RockWorks, etc.) using the Data Editor’s File | Import menu option.
For the purposes of this tutorial, we’ll go with the first option.
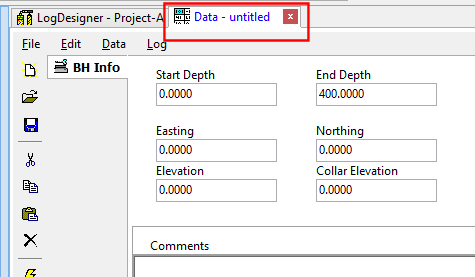
- Access the Data Editor window by clicking on the Data tab.
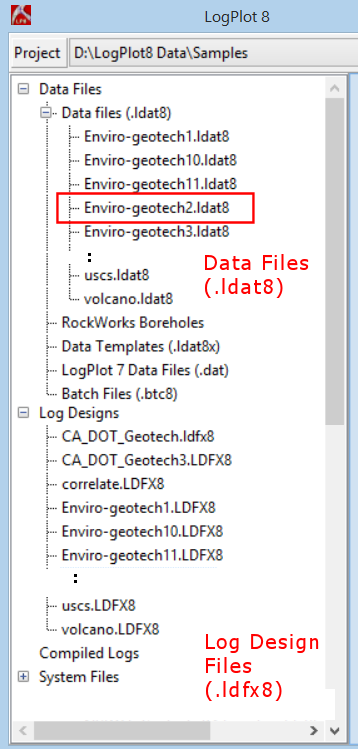
- Since the Project Manager pane still lists all of the sample data, expand the Data Files heading and locate the file "Enviro-geotech2.ldat8". Double-click on that file name to open it into the data editor.
- Save this file in your new project folder under a new name:
Choose the File | Save As menu option.
Browse to the Project-A folder (up one level, then open "Project-A").
Type in the file name: Project-A.ldat8 and click Save.
- Take a moment to look at the different datasheets in the file, each with a clickable tab.
- The BH Info datasheet contains the starting and ending depth for the borehole, location coordinates, and optional comments.
- The E-Text datasheet contains header information (project number, etc.).
- The Lithology datasheet contains the rock type keywords and descriptions. This will plot in the pattern column and the description column.
- The Point-Data datasheet contains two columns of numeric data measured at depth points, which will plot in the design’s curve columns. (They can also link to Point Text columns.) Point Data datasheets can contain one or many columns of values.
- The Interval-Data datasheet contains two columns of numeric data measured over depth intervals. These will plot into Interval Text and Bar Graph columns. These datasheets can contain one or many columns of values.
- The Lab datasheet contains two columns of alpha-numeric data measured over depth intervals. These will plot into Interval Text columns. These datasheets can contain one or many columns data.
- The Type datasheet contains depth intervals and a fill "keyword" which will plot in a Fill Bar column.
- Edit just a few:
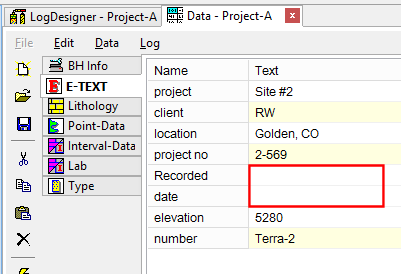
E-Text Datasheet:
- Click on the E-Text tab and click in the Recorded cell. Type in your initials.
- Click in the Date cell and type in today's date.
-
Lithology Datasheet:
- Click in the Lithology tab and double-click in the first keyword cell where you see "Clay and Sand". In the displayed window, where the current library of "keywords" are displayed.
-
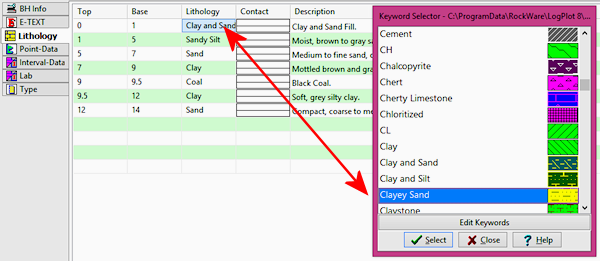
- Scroll down to "Clayey Sand" and click on that term. Note how the pattern changes for this rock type. Then click on the Select button to record that keyword, and then on the Close button to close the window. Now "Clayey Sand" is defined for this depth interval.
- Save your changes by clicking on the Save button
 .
.
- Let’s be sure there’s nothing missing from the data file before we try compiling: Click on the Data Editor’s Data menu, and choose the Check Data Against Log Design option. This will compare all of the fields in the data file against those in the log design, and let you know if data is missing or mis-matched. You should see a message that they match. Good.
 Back to menu | Next ( Compile the log )

RockWare home page