 Time: 1 minute
- Click on the Compile button
 or select the Log | Create a Log menu option, or type Ctrl+L.
- Establish these compile settings:
Click the Fit to Page button to establish the plotting scale. (Your scale may be different.)
Set the layout to Page Breaks and check the header and footer settings.
Set the Header/Footer to Body Margin to 0.1
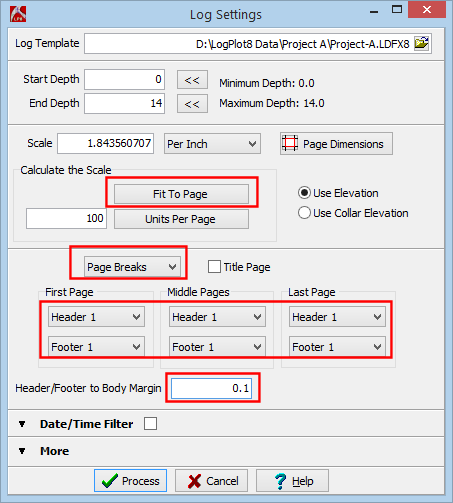
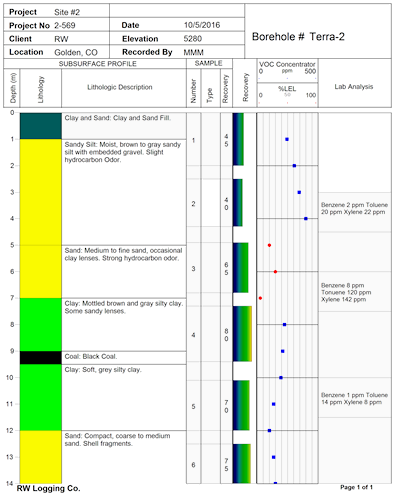
- Click the Process button.
LogPlot will read the data file entries, match them to the items in the log design, and create the graphic log. The log will be displayed in the Log View window.
- 4. Save the log: Click on the Save button
 , enter the name: Project-A.LPT8 and click Save. You can open this file at a later date and view the log within LogPlot.
- Export the log: Select the File | Export as PDF menu option. Browse to the Project-A folder, type in the name: Project-A.PDF and click Save. The PDF file will be displayed in your default viewer (such as Adobe Acrobat). PDF files are very handy to share with co-workers and clients.
You can return to the main menu at this time, or continue on to the next lesson.
 Back to menu | Next ( Import LAS Data )

RockWare home page