- Top: Use your mouse to drag this field, representing the depth at the top of the interval, to the appropriate AGS depth field.
Click the View Table Data button if you would like to look at the AGS source data. You can leave that window open while you map the LogPlot fields. - Base: Use your mouse to drag this field, represending the depth at the base of the measurement interval, to the appropriate AGS depth field.
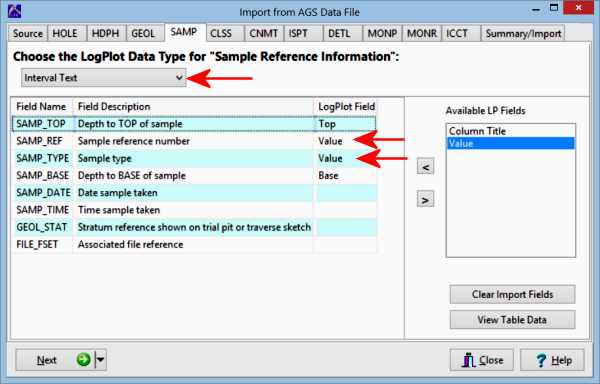
- Column Title: If the AGS data contains a Determinand column, this indicates that each component is listed on a separate row.
Drag the LogPlot Column Title field here. This will tell LogPlot how many columns will be created in the Interval Data datasheet, and the titles to assign to the columns. - Value: Drag this item to the desired AGS field(s). If each component is listed on a separate row, you will map one Value column. If the components are listed in columns, you can assign multiple Value columns, as shown in the example above.
Or, click on a tab at the top of the screen to select the next AGS data block to map.
Or, click on the small drop-down arrow by the Next button to jump directly to the next import screen of interest.