The Borehole Manager I-Data (Intervals) table is used to enter numeric data which were sampled at depth intervals (with a depth to top and depth to base) down the boreholes. This might apply to downhole geochemistry values (assays, ppm's) or geotechnical values (blow counts). Leave this table blank if you have no interval data.
! This table does not accept text entries. It accepts numeric values only.
See
Interval Text (I-Text) for entry of textual (alphanumeric) data
Time-Based Interval (T-Data) for information about numeric data sampled with date records
Downhole Point (P-Data) for information about entering point-sampled ("curve") data
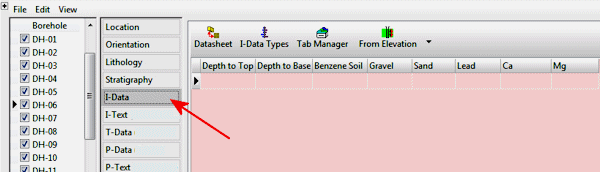
Accessing the I-Data Table
- Access the Borehole Manager
- Create a new project as necessary.
- Create a new well if necessary, or click on the existing well to be edited.
- Click on the I-Data table for the well.
-
Define the data columns if necessary: You can have multiple columns in this table, for your different I-Data components; use the I-Data Types button at the top of the table (or the Project Tables / Types Tables / I-Data Types item in the Project Manager) to define these. (More.)
I-Data Fields
Once you have the data columns defined, you can enter the measurements themselves. These instructions are for hand-entering the data; please see the links at the end of this topic for other options.
- Depth to Top: Enter the measured depth to the top of the first sampled interval for the well.
! The depth units must be the same as the Vertical units you defined for the project (and which are displayed on the Location table). For example, if the elevation and TD for the hole are shown there in feet, then the depth listings here must be in feet as well.
! The depth values must be positive.
- Depth to Base: Enter the measured depth to the base of the first sampled interval for the well.
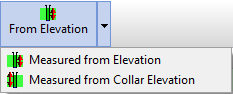
- From Elevation / From Collar Elevation: Use this button at the top of the table to define for this borehole which datum your depths were measured from.
- Choose Measured from Elevation if the depths were measured from the ground elevation (entered as the "Z (Elevation)" field in the Collar Coordinates tab). This is the default setting.
- Choose Measured from Collar Elevation if the depths were measured from the collar elevation (entered as the "Collar Elevation" field in the Collar Coordinates tab).
- Column 1: Click in (or <Tab> to) the first column to the right of the depths and type in the measured value for that downhole interval, for that component. If you have no data for an interval, you can leave the cell blank. Blank cells will simply be skipped during processing. Only numeric data is permitted.
- Column 2 - Column x: Click in (or <Tab> to) the next column to the right of the first, and type in the measured value for that component, for that interval. Repeat for as many columns as you have measurements for, for that depth interval.
- Move on to the second row, clicking in its Depth to Top column, and type in the measured depth to the top of the second sampled interval for the well. Continue in this manner, specifying depth intervals and measured values, for the entirety of your data. Example:
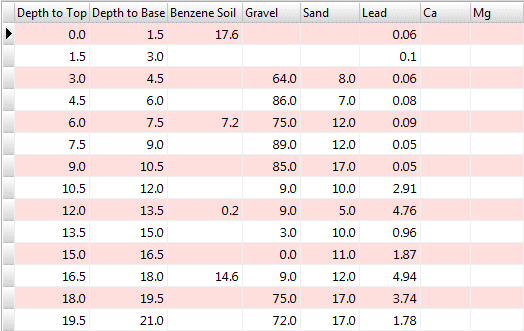
There is no limit to the number of downhole intervals that you may list for each drill hole, though if you are creating solid models, the more intervals the slower the processing.
See also
 Back to Data Introduction

RockWare home page