The color model is a great means to visualize the spatial distribution of interpolated colors in a solid color model, and you can use the filtering tools to see specific color ranges. RockPlot3D also offers a slicing tool that allows you to visualize what’s in the model at any particular horizontal or vertical plane. Multiple slices can be inserted.
Step-by-Step Summary
- In the Data pane of the RockPlot3D window, right-click on the name of the solid color model to be modified, and choose Options.
- Draw Style: Hidden: Determine (either now or later) whether you want to display the color model along with the slices. In order to hide the model nodes entirely, set the Draw Style to Hidden and click Apply. Should you wish to re-display the model, choose Voxels, Solid, Wire Frame, or Points and click Apply.
- Slices: Now, locate the Slices section at the bottom of the Isosurface Options window.
- Horizontal: To insert a horizontal slice, click in the Horizontal radio button. The slider bar will represent the base of the model to the left and the top of the model to the right. The elevation represented for any slider bar position is displayed in the window. Drag the slider bar until the desired elevation is displayed and click the Add button to insert the slice. You should see the slice displayed in the View pane, and the slice will be represented as a new item in the Data pane.
- North-South: To insert a north<->south vertical slice, click in the North-South radio button. The slider bar’s left edge will represent the western boundary of the model, and the right edge will represent the eastern boundary of the model. The X coordinate represented for any slider bar position is displayed in the window. Drag the slider bar until the desired X coordinate is displayed and click the Add button to insert the slice. You should see the slice in the View, and the slice will be represented as a new item in the Data pane.
- East-West: To insert an east<->west vertical slice, click in the East-West radio button. The slider bar’s left edge will represent the southern boundary of the model, and the right edge will represent the northern boundary of the model. The Y coordinate represented for any slider bar position is displayed in the window. Drag the slider bar until the desired Y coordinate is displayed and click the Add button to insert the slice. You should see the slice in the View, and the slice will be represented as a new item in the Data pane.
- Repeat this process to add multiple slices. You can insert multiple slices in a model, but they must be inserted one at a time. If you cannot see the slices, try displaying the voxel model to a Draw Style of Hidden.
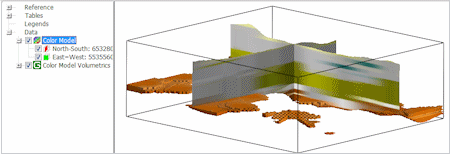
In the example below, one vertical N-S slices and one vertical E-W slice have been added to a color model. The color model itself has been filtered so only a limited number of voxels are visible.
See also
- Slice Options for information about adjusting their position and appearance. (You can interactively drag the slices to fine-tune their position, filter out color values, change the transparency, etc.)
 Back to RockPlot3D Color Model Settings

RockWare home page