RockPlot2D | Data Menu Options
The RockPlot2D "Data Window" is displayed to the right of the RockPlot2D image window. It is used to display computed measurements and coordinates which result from the use of the Measure and Digitize menu tools. Each plot window that is open will have its own data window.
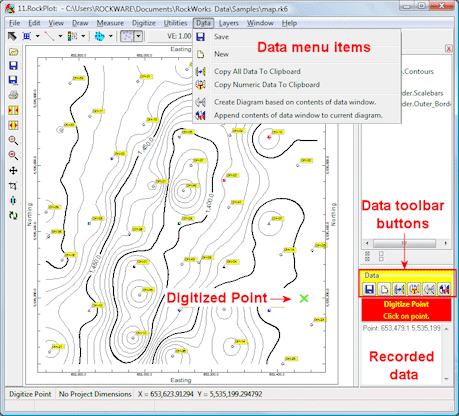
! If you don't see the data window in your RockPlot2D display, simply click the small "+" button in the upper corner of the window.

The RockPlot2D Data Window contains the following tools which can help you manage your measurements or digitized coordinates. These tools are available as buttons above the Data Window, or as commands in the Data menu.
 Save: Saves the contents of the data window in a text file.
Here's an example of what the text file might look like when opened into Windows Notepad:
Point: 652932.8 5535834.8
Point: 653024.1 5535772.0
Point: 652988.5 5535639.2
Point: 653031.3 5535476.4
 Clear: Clears all entries so that you can start a new data listing. You will NOT be warned that data will be lost.
 Copy all Data: Copies all data, including numbers and text labels, to the Windows clipboard for pasting elsewhere. Below is an example of what's copied to the clipboard for four points digitized using the Digitize | Points command:
Point: 652932.8 5535834.8
Point: 653024.1 5535772.0
Point: 652988.5 5535639.2
Point: 653031.3 5535476.4
! Don't use Ctrl+C to copy the data displayed in the data window. That command is reserved for copying the current plot - the picture itself - to the clipboard.
 Copy Numeric Data: Copies numeric data only (computations and/or digitized coordinates) to the Windows clipboard for pasting elsewhere. Below is what's copied to the clipboard for the same four points as shown above:
652932.8 5535834.8
653024.1 5535772.0
652988.5 5535639.2
653031.3 5535476.4
! Don't use Ctrl+C to copy the data displayed in the data window. That command is reserved for copying the current plot - the picture itself - to the clipboard.
 New Graphic: Creates a new plot containing only the graphic representation of the Digitized items (points, lines, polylines, and/or polygons) listed in the data window, using the styles and colors established under File | Options | Measure/Digitize Options. The new graphic can be saved as a Rw2D file (File | Save), appended to another Rw2D file (File | Append), and so on. Below is an example of digitized correlation lines saved as a new graphic, on its own:
 Append Current Graphic: Adds the graphic representation of the Digitized items (points, lines, polylines, and/or polygons) which are listed in the data window, to the existing image in the current plot window, using the styles and colors established under File | Options | Measure/Digitize Options. The new graphic can be saved as a Rw2D file (File | Save), appended to another Rw2D file (File | Append), and so on. Below is an example of these same correlation lines appended to the existing graphic.
! The digitized or measured data items are not stored in the graphic Rw2D file. You need to use the data tools shown above to save the data in a file, to store the data in the clipboard, or to record the data as graphic entities before closing the plot window, or you'll lose all of the data items.
! The Digitize items are held in temporary memory only. If you redraw the image (using Zoom In, Zoom Out, Best Fit, Stretch, or Vertical Exaggeration) the drawn items will disappear from the graphic display. Since they are recorded, however, in the Data Window, the Copy all Data, Copy Numeric Data, New Graphic, and Append Current Graphic tools are still available.
! The Data Window is not designed for you to edit the coordinates or measurements there. Thus, there is no Paste command for the Data Window. You may utilize either of two copy-data buttons, described above, for copying the data to the Windows clipboard for pasting elsewhere.
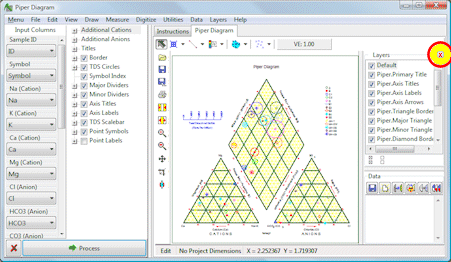
! To close the data pane portion of the RockPlot window, click on the red "X" button shown below. To re-display the data pane, click the "+" that's displayed in its place.
See also

RockWare home page