RockWorks | Borehole Manager | P-Data |
Analyze | GT (Grade x Thickness) Compositing
This program reads a column of P-Data that represents grade values (e.g. eUranium) and computes a variety of GT (grade x thickness) statistical information based on user-defined minimum grade and maximum waste-thickness cutoff values.
The output from this program may be stored within an Excel-compatible CSV file, I-Data columns, or a special XYZ file that may be used for subsequent point-mapping and/or contouring.
Feature Level: RockWorks Standard and higher
Menu Options
Step-by-Step Summary
Menu Options
- Input (Grade) Track: Click here to select the P-Data track that contains the grade data. For example, this might represent %eU3O8 (Uranium Grade Equivalent), ounces per ton Gold, etc.
- Vertical Point Spacing: Click here to define the depth intervals at which the P-Data grade values are entered.
! This tool requires that the data be entered at regular depth intervals.
- Data Convention: Expand this heading if necessary to define how the intervals are to be interpreted.
- P-Data represents top of interval: If this option is selected, the interval top will be the original P-Data depth and the base of the interval will be the P-Data depth plus the user-defined Vertical Point Spacing (established above).
- P-Data represents center of interval: If this option is selected, the interval top will be the original P-Data depth minus 1/2 * Vertical Point Spacing. The base of the interval will be the original P-Data depth plus 1/2 * Vertical Point Spacing.
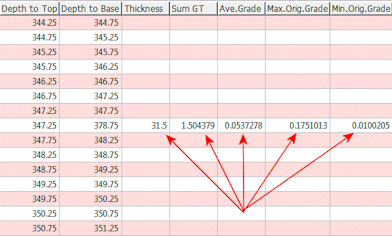
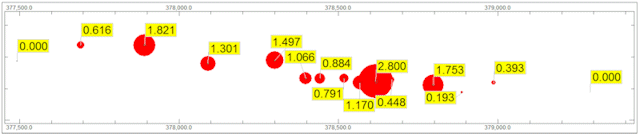
- Output: Expand this heading to define how the data are to be output. The output from this program may be saved within a CSV file, tracks (columns) within the P-Data table, and/or an ASCII (American Standard Code for Information Interchange) text file with xyz-style data for subsequent mapping.
- CSV File (Excel Report): If checked, the output from this program will be saved within a Excel-compatible CSV (Comma Separated Values) file as shown by the following example.
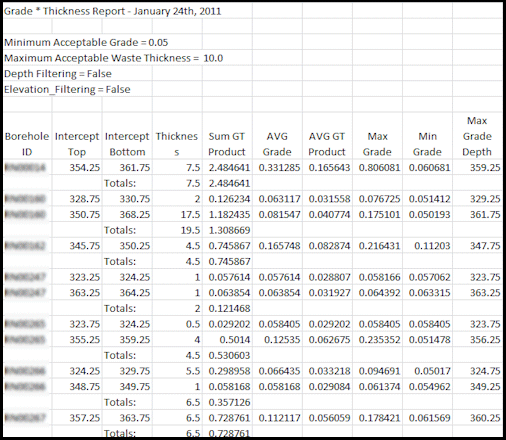
Because CSV files are "generic" (readable by a wide variety of programs - including RockWorks), there is no formatting. As a consequence, any special formatting such as column title centering, font sizes, etc, must be performed by the user after the CSV file has been auto-loaded into Excel.
- File Name: Click to the right to enter the name for the CSV file that will be created by the program and automatically loaded into Microsoft Excel (or whatever program has been associated, via your Windows settings, with the CSV file extension).
- Report Title: This is the title that will appear within the first row of the CSV file.
- Cutoffs: This are the primary filtering values that are used to determine the extents of the ore intercepts.
- Minimum Acceptable Grade: Click here to enter the minimum value in the Input track to be considered. This value determines what is considered "acceptable" ore.
- Maximum Acceptable Waste Thickness: This value defines the amount of waste, or "interburden" that is acceptable for zones that are bounded, above and below, by intervals that contain material that have "acceptable" grade values.
- Filtering: These options allow you to force the program to consider only input data within a specified depth and/or elevation range.
- Depth Filtering: If checked, this setting will cause the program to only process data that is between the specified minimum depth and the specified maximum depth. We specifically avoid the terms "above" or "below" because the borehole may be inclined upwards (e.g. an underground exploration hole drilled upwards).
- Minimum Depth: Sample intervals between the collar and this depth will be ignored.
- Maximum Depth: Sample intervals between this depth and the total depth (TD) of the hole (TD) will be ignored.
- Elevation Filter: If checked, the program will ignore all sample intervals above the maximum elevation or below the minimum elevation.
- Minimum Elevation: Sample intervals below this elevation will be ignored by the program.
- Maximum Elevation: Sample intervals above this elevation will be ignored by the program.
- Apply to: This program may be used to compute GT-related values for just the currently-highlighted borehole or all of the boreholes.
- All Enabled Boreholes: Compute GT-related values for all of the enabled boreholes (boreholes with a checked-box next to their names within the Borehole Manager).
- Currently Highlighted Borehole: Compute GT-related values only for the currently "active" borehole as defined by an arrow adjacent to the borehole name within the Borehole Manager.
Step-by-Step Summary
- Access the RockWorks Borehole Manager program tab.
- Select the P-Data | Analyze | GT (Grade x Thickness) Compositing menu option.
- Establish the desired menu options, as discussed above.
- Click the Process button to proceed with the computations.
The program will read the contents of the input P-Data track, determine for each borehole the areas where the minimum grade and maximum waste parameters are met, and determine the thickness of those zones or intercepts.
The program will record the computations in the requested output reports: Excel CSV and/or I-Data columns and/or XYZ file (you can choose as many of the output options as you like).
 Back to P-Data Menu Summary

RockWare home page