RockWorks | Utilities | Grafix | 3D-Utilities | Oriented Objects
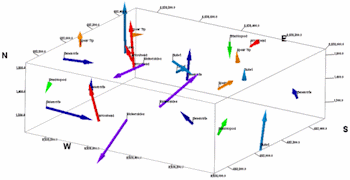
This program reads location, bearing, and inclination data from the Utilities datasheet and draws 3-dimensional arrows at those locations for display in RockPlot3D. Use this to display fossils, archeological items or other oriented items in 3D space.
Menu Options
Step-by-Step Summary
Menu Options
- Input Columns:
-
- ID: Select the column that lists the names of the objects, if any. These will simply be used to label the objects in the data tree within RockPlot3D.
- Color: Select the column in which the object colors are listed, if applicable. If you don't have colors in the datasheet, be sure you don't choose column-based colors under the diagram settings, described below.
- X (Easting), Y (Northing), Z (Elevation): Select the three columns in the datasheet that list the Easting, Northing, and elevation coordinates for each object. RockWorks will center the oriented symbols at the declared location. Be sure that you've defined the coordinate system and units for these columns.
- Direction: Select the column that lists the azimuth bearing of the object in a 0 - 360 degree format.
- Inclination: Select the column in the datasheet that lists the objects’ inclination, using a format whereby 90 = straight up, 0 = horizontal, and -90 = straight down.
- Length: Select the column in the datasheet that lists the object lengths. Be sure that you have define the units for this column.
- Group Name: Click here, in the middle pane of the window, to enter a name for the objects’ group in RockPlot3D. For example, if the objects represent fossils, you could name this "Fossils".
- Length Multiplier: Set this to "1" if the items are to be plotted using the lengths defined in the datasheet.
If you need to scale or convert the length measurements for display in the diagram, you can enter a value here. The entries in the data file will be multiplied by this value.
- Color:
-
- Defined by Color Column: Choose this if the colors are to be read from the column in the data file defined under the Input Column listing.
- Automatic (Based on Length): Choose this if the colors are to be chosen automatically, on a cold to hot color scale, based on the item length.
- Tube Radius: Type here the radius for the tube portion of the arrows, expressed as a percentage of the project size.
- Cone Radius: Type here the radius for the cone tip that is plotted at the end of the arrows, expressed as a percentage of the project size. If you want the cone to be flush with the tube, set this equal to the Tube Radius.
- Cone Height : Here you can enter the distance from the base of the cone tips to the end of the arrows, expressed as a percentage of the project size.
- Plot ID Labels: Insert a check to include sample ID labels with the objects.
-
- Font: Select the font size and color.
- X-Offset: X-distance from the arrow start to the label start.
- Y-Offset: Y-distance from the arrow start to the label start.
- Z-Offset: Z-distance from the arrow start to the label start.
- Reference Cage: Insert a check here to include reference labels or lines in the output 3D image. (More)
Step-by-Step Summary
- Access the RockWorks Utilities program tab.
- Open a data file that contains a listing of the XYZ coordinates for the objects, and their orientation and bearing.
- Select the Grafix | 3D-Utilities | Oriented Objects menu option.
- Enter the requested menu settings, listed above.
- Click the Process button to continue.
The program will read the indicated coordinates and create a 3D diagram that displays their placement using the indicated size, color, and direction. The completed diagram will be displayed in a RockPlot3D tab in the Options window.
- You can adjust any of the options along the left (colors, length, etc) and click the Process button to regenerate the 3D image.
! Each time you click the Process button, the existing display will be replaced.
- View / save / manipulate / print / export the image in the RockPlot3D window.
 Back to Grafix Menu Summary

RockWare home page