RockWorks Utilities | Grid | Grids -> 3D Stack
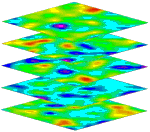
This program plots multiple flat grids in 3D space for the purpose of visual comparisons. These grid models can represent any real number values (geochemical concentrations, elevations, porosity values, quality readings, you name it). These are grid models that already exist on your computer.
Menu Options
Step-by-Step Summary
Menu Options
- Specify the Input Column information in the left pane of the window:
- Grid Names: Select the name of the column in the currently-open datasheet that lists the names of the grid files (.RwGrd) that are to be stacked. All of the grid names will be listed in a single column in the datasheet. The grid file names must be listed from top down in the same order in which they are to be stacked, top-down.
- Top Elevation: Click here to type in the elevation at which the first grid model is to be displayed in the 3D stacked diagram. The program will assume that the elevation you enter is in the same units as the X and Y location coordinates in the grid models. For example, if your X and Y units are in feet, the program will assume this elevation is declared in feet as well.
- To obtain a well-proportioned diagram, you should be sure that the elevation you enter here and spacing values you declare below are consistent with the X,Y range in the grid models. For example, if your grid models cover about 10,000 x 10,000 feet, you shouldn’t set the spacing to 1-foot intervals. Or, if your grids are very localized (say, 500 meters x 500 meters) you wouldn’t want to set the spacing to 1000 meter increments.
- Spacing: Click on this item to type in the vertical spacing for the flat contour maps. The program will assume that the vertical units are the same as the horizontal units.
- Color Scheme: Click on this Options button to access a window where you can define the colors to use for the 3D surfaces. More.
- Perimeter: Insert a check in this heading to include a solid line perimeter around the flat grid surface. You can expand this heading to select the style and color for the perimeter line.
- Reference Cage: Insert a check here to include in the diagram a 3D frame with coordinates and elevation labels. (More.)
! If your Top Elevation and Spacing don't coincide with your output dimensions, be sure to set the Reference Cage's dimensions to Automatic.
Step-by-Step Summary
This tool requires that one or more RockWorks-format grid models already exist.
- Access the RockWorks Utilities program tab.
- Open or create a data file that lists the names of the grid models (.RwGrd) to be displayed a flat color-contoured planes in the 3D diagram.
- The program assumes that each grid model resides in the current project folder.
- The grid models will be illustrated in the stacked diagram from top down, with the first model displayed at the starting elevation declared below.
- The grid file names should be listed in a single column in the datasheet, the uppermost grid name in row 1, the next grid name in row 2 of the same column, etc.
- Be sure to list the full name, with extension (e.g: surface1.RwGrd).
- Select the Grid | Grids -> 3D Stack menu command.
- Enter the requested menu options, described above.
- Click the Process button to continue.
The program will read the grid model names from the datasheet, creating for each a flat, color-contour image. The first GRD model’s map will be displayed at the requested Top Elevation, and subsequent images will be spaced downward based on the requested Spacing. The completed diagram will be displayed in a RockPlot3D tab in the Options window.
- You can adjust any of the diagram options in the pane to the left and then click the Process button again to regenerate the diagram.
! Each time you click the Process button, the existing display will be replaced.
- View / save / manipulate / print / export the image in the RockPlot3D window.
Tips: You can turn individual surfaces on and off by inserting/removing the check-marks by the grid model names in the RockPlot3D data tree (you may need to expand the "Stack" heading). If you expand the grid model groups in the data tree, and double-click on any of the Flat Grid entities, you can adjust the color scheme, drawing style, and other visual characteristics.
 Back to Grid Menu Summary

RockWare home page