RockWorks | Utilities | Grid | Directional Analyses |
Grid -> Rose Diagram
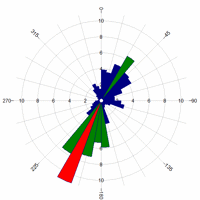
This program tool reads a grid (surface) model and computes the changes in Z-values (elevations) between neighboring nodes, noting the direction (0 to 360) of steepest change (= "aspect"). It then creates a rose diagram to summarize the directionality of the aspect bearings (dip direction) or of the corresponding structure bearings (strike direction).
Note: This program requires that a RockWorks surface (grid) model already exist.
Menu Options
Step-by-Step Summary
Menu Options
- Input (Surface/Terrain) Grid: Click to browse for the name of the existing grid model (".RwGrd" file) to be analyzed and displayed as a rose diagram.
- Direction Represented by Rose Petals:
- Aspect (Dip Direction): Choose this option if the rose petals are to represent the direction at which the surface's grid nodes slope (= the dip direction).
- Structural Axes (Strike Direction): Choose this option if the rose petals are to represent the strike direction (=90 degrees counter-clockwise of the aspect azimuth).
- Petal Radii & Annotation Based On... Expand this heading to access these options which will determine what the petal lengths will represent. (See examples.)
- Frequency (Occurrences per Bin): With this option, the length of the rose petal will represent the number of occurrences of azimuth measurements that fall within that bin.
- Frequency % (Frequency as a % of Total Population): With this option, the length of the petal will represent the percent of total measurements that fall within this bin.
- Azimuth Filter: Expand this item to activate one or both bearing filters by inserting a check in the check box(es). (More.)
- Diagram Style: Select either Full for a full, 360-degree rose, or Half for a northern-half rose.
- Rotate: Insert a check in this box to turn on data rotation. Expand this heading to enter the amount in degrees clockwise from North (0 to 360) by which each grid node aspect should be rotated. (More.)
- Bi-directional: To specify that your data be considered bi-directional in nature, insert a check in the Bi-directional check-box. If the data is uni-directional, be sure that this box is cleared. (More.)
- Circles: To include concentric reference circles (full rose diagrams) or arcs (half rose diagrams) that signify percent or frequency or length (per the petal type you've selected), insert a check in the Circles check-box. Expand this item to select circle settings. (More.)
- Rays: Check this box to include reference rays, which extend from the center of the rose outward. Expand this item to set the color and ray spacing in degrees.
- (More.)
- Petals: To turn on the plotting of the rose petals, insert a check in the Petals check-box. Expand this item to set the petal outline and fill options.
- (More information.)
- Outline: Expand this heading to select the petal outline color and line thickness.
- Opacity: Expand this heading to establish the petal fill, if any.
- Width: Choose the degree span for the petal bins.
- Mean Ray: Insert a check in this box to turn on the plotting of the mean vector ray, which represents the mean vector computed from the input grid. Expand this item to select the line style and color, and whether arrowheads are to be included. (More.)
- Mean Error: Insert a check here to activate the plotting of an arc that represents the interval around the vector mean that most likely contains the true population mean direction. Expand this item to select the line style and color, and the confidence interval. (More.)
- Title: To turn on the plotting of a title, insert a check in this check-box. Expand this item to enter the title text (40 characters maximum), color, and text size (expressed as a percent of the diagram width).
- Legend: Insert a check here to include a legend in the diagram. This legend lists computed statistics and some diagram settings. Expand this item to set the legend dimensions, border style, title, text color, and more.
- (More.)
- Maximum Diameter: Choose whether the maximum diameter of the rose should be the longest petal or the outermost reference circle. (More.)
- Minimum Diameter: Click to set the inside diameter for the rose. This permits you to create an inner "ring" that contains no lines or color fill. This radius value is declared as a percent of the diagram size. Default = 0.25. (More.)
Step-by-Step Summary
- Be sure you have a RockWorks grid model (.RwGrd file) already created, for input into this program.
- Access the RockWorks Utilities program tab so that you can see the Grid menu. It is not necessary to open a datasheet.
- Select the Grid | Directional Analyses | Grid -> Rose Diagram menu option.
- Enter the requested menu settings, described above.
- Click the Process button to continue.
The program will read the input grid model, compute the slope and aspect for each node, and determine the dip direction or strike direction for each node. It will then tally the number of nodes whose direction falls within the petal groupings, and will generate a rose diagram using the requested diagram settings. The rose diagram will be displayed in a RockPlot2D tab in the Options window.
- You can adjust any of the settings in the Options window (input grid model name, diagram settings, etc.) and then click the Process button again to regenerate the rose.
! Each time you click the Process button, the existing display will be replaced.
- View / save / manipulate / export / print the diagram in the RockPlot2D window.
 Back to Grid Menu Summary

RockWare home page