RockWorks | Utilities | Grafix | 3D Utilities | Urchingram
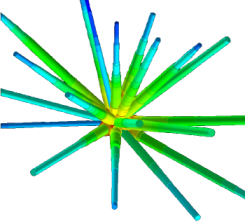
Use this program to read a listing of azimuth bearings, inclination angles and lengths, and display them as arrows or tubes in 3D as a single "urchin" shaped object. This can be used to display directional variability.
Menu Options
Step-by-Step Summary
Menu Options
- Input Columns: The prompts along the left side of the window tell RockWorks which columns in the input datasheet contain what data.
Click on a displayed name to select a different name from the drop-down list.
-
- Color: Choose the column where the samples' colors are defined. If you choose Fixed colors for the tubes, this column will be ignored; this data is not required.
- Direction: Select the column where the azimuth bearings (0-360) are listed.
- Inclination: Select the column where the samples' inclinations are listed. These should be listed with 90 = straight up, 0 = horizontal, -90 = straight down.
- Length: Select the column where the samples' lengths are listed. This can represent total counts of measurements (as a 3D rose diagram or a 3D variogram), actual fracture lengths, etc. This will be used to determine the length of the tubes; a multiplier can be defined, below.
- Length Multiplier: If you need to scale or convert the length measurements in the data file for display in the diagram, you can enter a value here. The Length entries in the data file will be multiplied by this value.
- Color:
- Column-Based: Choose this if the colors are to be read from the column in the data file defined under the Input Column listing.
- Automatic: Click here if the colors are to be assigned automatically, on a cold to hot color scale based on the item length.
- Tube Radius: Type here the radius for the tube portion of the arrows, expressed as a percentage of the project size.
- Cone Radius: Type here the radius for the cone tip that is plotted at the end of the arrows, expressed as a percentage of the project size. If you want the cone to be flush with the tube, set this equal to the Tube Radius.
- Cone Height : Here you can enter the distance from the base of the cone tips to the end of the arrows, expressed as a percentage of the project size.
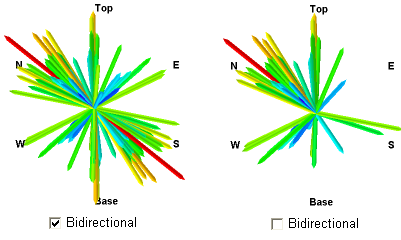
- Bidirectional: Check this box if the program should extend each arrow 180 degrees opposite the listed measurement, representing bi-directional data.
Step-by-Step Summary
- Access the RockWorks Utilities program tab.
- Open a data file that contains a listing of measurements: 0-360 degree dip azimuth, 90 (up) to -90 (down) dip angles, and (optional) lengths and colors.
- Select the Grafix | 3D-Utilities | Urchingram menu option.
- Enter the requested menu settings, listed above.
- Click the Process button to continue.
The program will read the indicated measurements and create a 3D diagram that represents their directionality with arrows of the requested size and color. All arrows will start at an origin of 0. The completed diagram will be displayed in a RockPlot3D tab in the options window.
- You can adjust any of the diagram options in the pane to the left and then click the Process button again to regenerate the 3D image.
! Each time you click the Process button, the existing display will be replaced.
- View / manipulate the image in RockPlot3D.
 Back to Grafix Menu Summary

RockWare home page