RockWorks | Utilities | Grafix |
3D Utilities | Fault Polylines -> Fault Surface
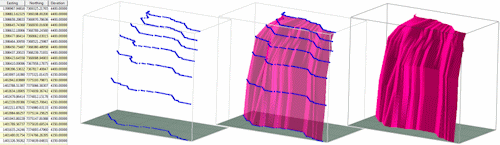
Use this program to generate a triangle mesh based on two or more polylines that represent contours along a fault surface. These surfaces are for visualization only. See the Fault menu tools for generating 3D fault tables for modeling.
Caveats/Conventions:
- The polyline data must be listed in the same order for each polyline. For example, if a north/south polyline was digitized from south to north, the other polylines must be digitized in the same order.
- The program can only create one surface per RwDat file. If you have more than one fault surface, they must be compiled separately and combined manually into a single RockPlot3D file.
Menu Options
Step-by-Step Summary
Menu Options
- Input Columns: In the pane to the left, define the columns in the datasheet where the input polyline data is listed:
- X (Easting): Choose the column containing the polyline X-coordinates.
- Y (Northing): Select the column where the polyline Y-coordinates are listed.
- Z (Elevation): Select the column containing the polyline elevations.
- Fill: Check this box to fill the triangles with a solid color. Click the Color box to choose the fill color.
- Mesh: Check this box to include mesh lines along the surface.
- Color: Click here to select a color for the mesh lines.
- Thickness: Establishes the line thickness. The default value of "1" will produce thin lines.
- Group name: Enter the name to be assigned to the surface's data group in RockPlot3D. Note that you can change the name in RockPlot3D itself should you need to.
- Reference Cage: Check here to include a 3D frame of lines and axis labels in the image.
- Expand this heading if necessary to access the Cage Options button.
Step-by-Step Summary
- Access the RockWorks Utilities program tab.
- Open a data file that contains a listing of polyline XYZ coordinates.
- Select the Grafix | 3D Utilities | Fault Polylines -> Fault Surfaces menu option.
- Enter the requested menu settings, listed above.
- Click the Process button to continue.
The program will read the listed polylines and resample each such that every polyline has the same number of vertices. It will then construct triangles between adjacent contours, filling them as requested. The completed diagram will be displayed in a RockPlot3D tab in the options window.
- You can adjust any of the diagram options in the pane to the left and then click the Process button again to regenerate the 3D image.
! Each time you click the Process button, the existing display will be replaced.
- View / manipulate the image in RockPlot3D.
 Back to Grafix Menu Summary

RockWare home page