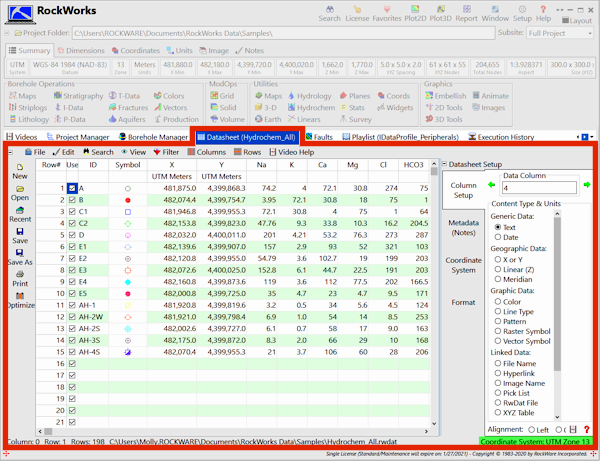
The RockWorks Datasheet program tab contains a row-and-column datasheet window designed for entering miscellaneous data. These data can include simple XYZ data for generating point and contour maps, strike and dip data for stereograph plots, hydrochemical ion lists for Piper diagrams, and much more.
The data you enter into the RockWorks Datasheet can be used to create many different types of maps and diagrams, using various programs in the menu ribbon at the top of the program window.
"Borehole" data, consisting of downhole lithology, stratigraphy, geochemistry, geophysical and other measurements are entered into the separate "Borehole Manager", discussed in a separate section of this tutorial (click here to jump to that lesson set).
![]()