Peripherals | Color Legend
The Color Legend option is used to access settings for the color legend that can be displayed in 2D color-filled contour maps and diagrams. Many of these settings can also be changed once the map is displayed in RockPlot2D by clicking and dragging (width & height) or double-clicking (accessing other properties).
 Peripherals
Check this item to activate one or more peripheral layers for your map or diagram.
Click on this tab to establish the layer settings.
- Color Legend
Check this item to include a legend to colors in a color-contour map or diagram.
Click on this tab to set up the legend details.
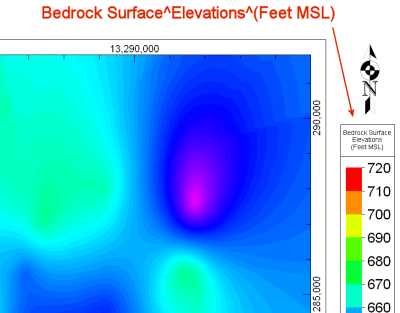
- Title: Check this box if you want the legend to include a title, and type the title text into the small prompt box.
Tip: Use the carat symbol "^" (upper case on the #6) to break the title text into separate lines.
-
- Border: Insert a check in this box to plot the outer border for the legend. Click on the line box to choose the style, thickness, and color for the border lines.
- Cell Outlines: Insert a check here to plot a solid line perimeter around each color block. Click on the line box to choose the style, thickness, and color for the lines.
- Tick Marks: Insert a check here to plot tick marks next to the color blocks. Click on the line box to choose the style, thickness, and color for the tick lines.
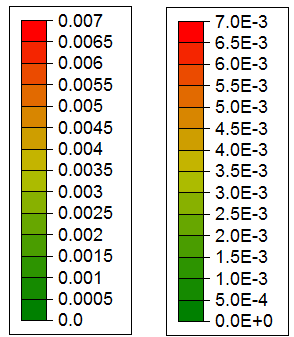
- Manual Decimals: Activate this option to override the default program-determined decimal places for the color legend value labels. Use the arrows or type in the number of decimal places you would like to have represented in the legend.
- Decimate Labels: Use this setting to reduce the number of labels displayed in the legend. Typically you would leave this at 1, so that the program automatically computes the number of labels to display. If you wanted to display half as many labels as the default, you would enter "2" in this setting. For a third as many labels as default, you would enter "3", and so on.
- Scientific Notation: Check this box to display the values using scientific notation.
-
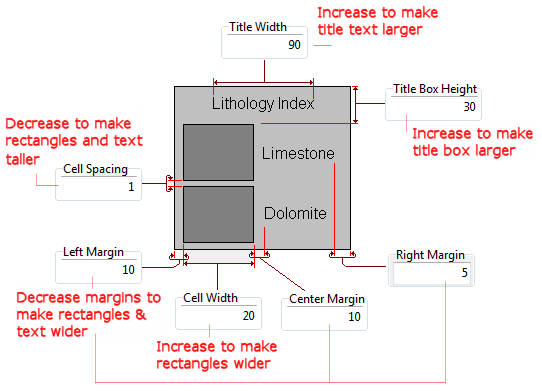
- Dimensions: The dimensions are defined as a percent of the size of the legend itself. In this manner you can resize the legend interactively in RockPlot2D (using your mouse) and the components will scale accordingly.
-
- Color Legend Position and Dimensions: Use these settings, to the right of the design pane, to define where the legend is to be plotted in relation to the main map or diagram.
! As you click and drag the legend in the Peripherals design pane, the values in these prompts will be updated. Similarly, as you edit the values in these prompts, the legend size and placement will be updated in the design pane.
- X: This setting represents horizontal offset. It determines how far, as a percent of the diagram width, the legend is to be offset from the main diagram. The greater the value you enter, the further the legend will be offset from the diagram.
- Y: Determines how far, as a percent of the diagram height, the legend is to be offset vertically in relation to the diagram.
- W: Set the width for the legend as a percent of the output diagram width.
- H: Set the height for the legend as a percent of the output diagram height.

RockWare home page