RockWorks | Borehole Operations | Lithology | Plan Map
Use this program to:
- Create a 3-dimensional solid model representing interpolated lithology types (an .RwMod file)
- OR -
Read an existing lithology .RwMod file you've already created.
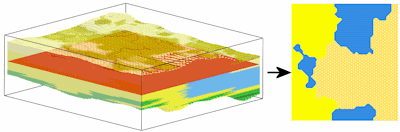
- Extract the node values from the solid model where they intersect a horizontal plane, storing this as a 2D grid model (.RwGrd file).
- Create a 2-dimensional map representing the lithology grid, and display this in a RockPlot2D window (an .Rw2D file)
In other words, it creates a geological lithology map based on downhole data. The lithologies will be represented in the model using the numeric "G-values" declared in the Lithology Types Table. The lithologies will be represented in the map using the background colors and/or patterns defined for the materials in the Lithology Types Table. The completed map is displayed in RockPlot2D.
See also
Lithology Surface Maps for lithology maps that intersect a grid-based surface rather than a horizontal plane.
Feature Level: RockWorks Standard and higher
Menu Options
Step-by-Step Summary
- Rules & Filters
Use the buttons at the top of the window to apply spatial filters and/or time/date filters to data being displayed in your map. (More info)
- Model
Click this tab to define whether you want to create a new lithology solid model or you wish to use an existing lithology solid model (from a previous use of this program or another Lithology menu program), by clicking in the appropriate radio button.
! NOTE ! This is not trivial. Creating the lithology model can take some time, depending on the resolution of the model and the detail of your data. If you already created a pleasing model for display as a 3D voxel diagram, for example, you can use the same model, which was stored on disk as an .RwMod file, for the plan map.
- Create New Model: To create a new model for the map, click in this radio button, and use the tabs to the right to establish the modeling settings.
- Solid to be created: You may use the default program-assigned name, or click to the right to enter a different name for the lithologic model, such as "lithology". The program will append automatically the file name extension ".RwMod".
- Create Filtering/Resampling Report: Check this item to generate a text report of the results of any spatial filtering you applied.
- Limit Input: Check this box to activate an input data filter based on material type. Click on the tab to enter the filter settings. (More info)
- Limit Output: Check this box to filter the output model based on material type. (More info)
- Algorithm: Click this tab to select the modeling method to use, for interpolating your lithology model. (More info)
- Special Options: Click on this tab to establish other model settings, such as tilting, warping, filtering above-ground, and smoothing. (More info)
- Use Existing Model: If you wish to use an already-existing lithology model, click in this radio button.
- Solid Model: Browse for the name of the existing lithology model (.RwMod file) to be used for this map.
- Output Grid: Click here to type in the name to assign the output grid that will be created as a result of extracting a specific slice from the solid model. This grid model's nodes will be assigned the "1"s "2"s "3"s, etc., that represent your lithology rock types (defined in your Lithology Types Table) as they appear at the selected elevation. (You'll choose the elevation level after setting up the menu options.) RockWorks will automatically append the ".RwGrd" file name extension.
- Slice Selection
Click here to define how you want to define the elevation location for the map.
- Select Interactively During Processing: Click here to have the program display a window, after you click the Continue button, where you can interactively select the elevation for the map slice.
- Preselect: Choose this to define the elevation in advance, and enter that elevation (in project units) into the prompt. If you are including this program in a Playlist or Command script, you'll need to pre-select the elevation.
- Diagram Options
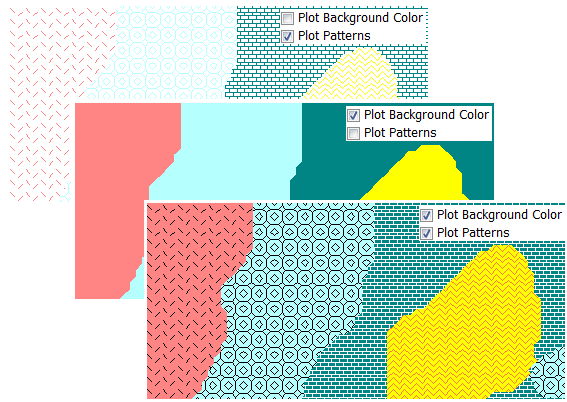
- Plot Background Color: Insert a check here to display the lithology zones using the background colors defined in the project's Lithology Types Table.
- Plot Patterns: Insert a check here to use the graphic patterns, established in the Lithology Types Table, to represent the lithology zones in the output map.
-
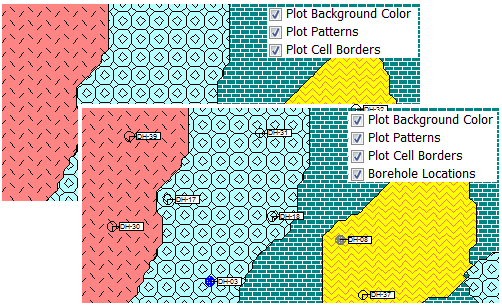
- Plot Cell Borders: Check this box to display the grid model's cell borders either around all cells or around contiguous lithology zones.
- Bevel Edges: Check this to draw borders only around contiguous lithology zones, and to "bevel" the corners so that they're not sharp 90-degree angles. Leave this box cleared to display borders around all grid cells.
- Line Style: Click here to define the line thickness, style, and color for the borders.
-
- 2D Map Options
Use these checkboxes to append other layers to your map.
Click each tab to set up the 2D map layers (image, map peripherals, map border, etc.).
- Output Options: Use these settings to define whether the output graphic is to be saved (or displayed as "untitled"), how the file should be named, and whether it is to be displayed after it is created. It also offers export options. (More info)
- Access the RockWorks Borehole Manager program tab.
- Enter/import your data into the Borehole Manager. This tool specifically reads location, orientation (if any), and lithology data.
- Select the Borehole Operations | Lithology | Plan Map menu option.
- Enter the requested program settings, described above
- Click the Continue button to proceed.
If you've selected Use Existing Model, the program will load the information from the existing lithology model (.RwMod file), and will proceed to diagram generation.
If you've selected Create New Model, the program will scan the project database and extract the borehole locations, lithology depths and materials, and any borehole orientation. It will apply any source data filters you have requested, and will interpolate the solid lithology model.
- If you have chosen interactive slice selection, RockWorks will then display a window listing all of the elevation levels in the lithology model. Choose the elevation to be represented in the plan-view map, and click OK. (Note that the elevation increments correspond to the vertical node spacing in the solid model.)
The program will then read all of the voxels in the lithology model at the selected elevation, and store that lithotype in the output grid model. The program will then create the 2D lithology (geology) map using the requested diagram settings. The completed diagram will be displayed in a RockPlot2D tab if requested.
- You can adjust any of the modeling or diagram settings in the Options tab and then click the Continue button again to regenerate the lithology map.
! * If the lithology model looks OK and you just need to adjust one of the diagram settings, you don't need to keep re-interpolating the model. Choose Use Existing Model and browse for the lithology .RwMod file to be used for the map.
- View / save / manipulate / print / export the image in the RockPlot2D window.
- Another way to view a horizontal slice within a lithology model is using the solid model slice tools in RockPlot3D.
 Back to Lithology Menu Summary

RockWare home page