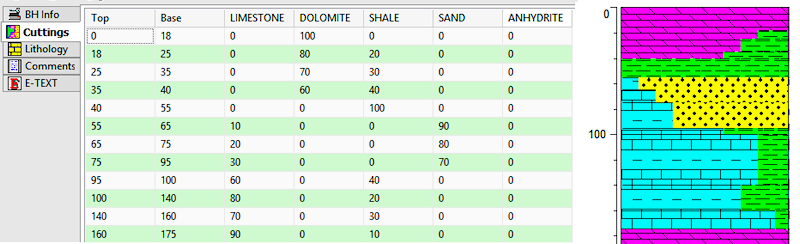
This illustrates the use of a Pattern Percent column to represent relative lithologies measured from the drill cuttings.
Introduction
Example
How to enter Percent Data
Use: The LogPlot Percent datasheet is used to enter relative percentages of multiple lithology materials over a depth interval, such as drill cuttings.
Corresponding log design component: Percentage data listed in the Percent datasheet will be plotted within the Pattern Percent column of the same name, if any, in the log design.
Corresponding RockWorks data table: none
Right-Click Options: When you right-click in any of the Percent datasheet's cells, you have the following options:
Cut, Copy, Paste Rows Columns Edit Data Page Name Edit Columns Delete Data Page Move
This illustrates the use of a Pattern Percent column to represent relative lithologies measured from the drill cuttings.
Automatic:
If there is already a Pattern Percent column in the current log design to which you’ll be linking the data, you can use the Data | Update Data from Log Design tool to insert a new Percent datasheet in the current data file. The program will know how to name the datasheet (tab) based on the log design information.
Manual:
Select the Data | New Data Page | Percent menu option to manually insert a Percent datasheet into the current file.
New Name: Type in the name to assign to the datasheet. LogPlot will use this name to match data to the item in the log design.
Click OK.
The program will add to the data file a Percent datasheet labeled with the selected name.
Shortcut: Use the right-click options to rename the data page.
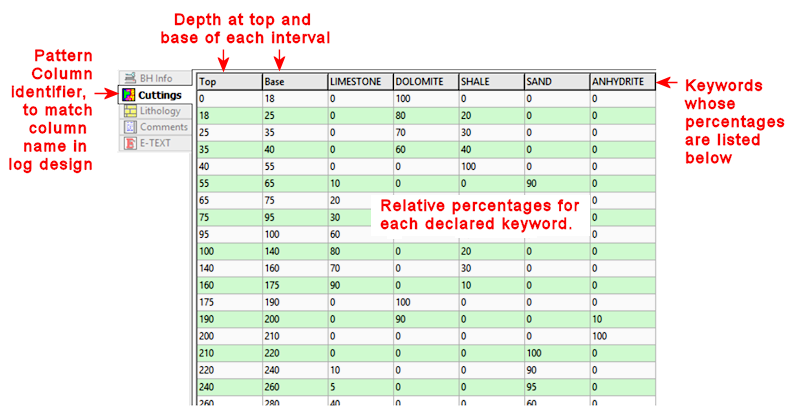
Name: The name displayed on the datasheet's tab is used to match the data to a particular Percent column in the log design. This name is declared when you first create the data page (above) and can be edited using the Data | Edit Data Page Name menu option.
Top, Base: In these columns you must list the depth at the top and the base of the pattern percent interval being described on that row. Depths are entered as positive values.
Shortcut: Right-click on any cell in the Percent tab and select Fill Interval Column to fill the columns with regular depth increments.
Columns 3+: These columns represent the rock types for which you will be declaring percentage representation. The rock type keywords are displayed as column headers.
The Column Names
To change the names of the headers, or to add or remove headers, right-click on any cell in the Percent datasheet, and select the Edit Columns option.
The program will display the Pattern Percentage Editor window. In this window is listed the keywords that are to be displayed in the Percent datasheet. The top-down order in the listing corresponds to the left-right order of the column headings. See Edit Percentage Headers for more information.
The Data Listing
Type in the actual percentage data into the Percent data page cells. If you already have this percentage data in a tabular format in another application, you can copy the data there and then paste it into the Percentage tab using the Edit | Paste option.
![]() Back to LogPlot Datasheet Summary
Back to LogPlot Datasheet Summary
![]()