LogPlot8 reads drill hole data from a data file, "compiles" the data into a log design at a user-specified scale, and displays the graphic log picture on the screen. Here is a quick overview of the LogPlot program windows.
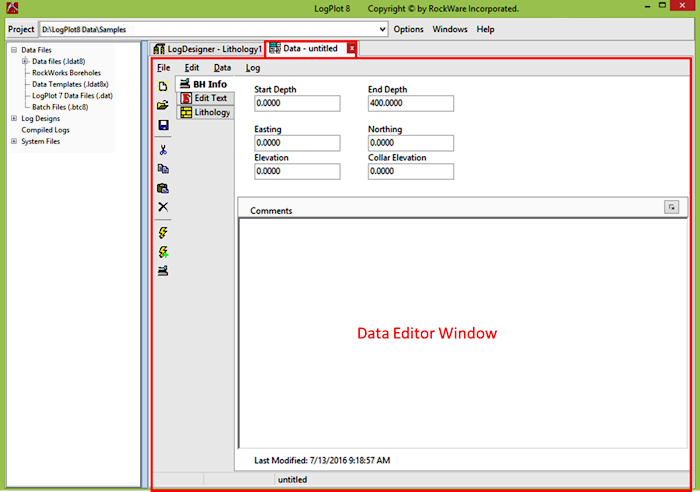
When the program starts, the first window you'll see is the Data Editor. This is where you enter/import your data. Each Editor window (you can have several open at a time) has a stick-up tab so it is easily accessible. The Editor organizes the different types of data into tabbed mini-datasheets. (See the Data Editor section for more info.)
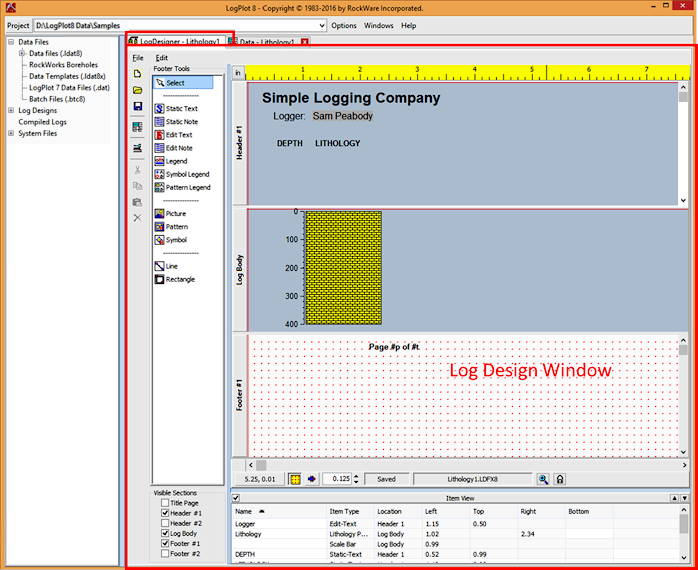
The log's design is created or modified in the Log Designer window. This is where you create or modify the design or blueprint of how the graphic log is set up. The Design window also has a stick-up tab for easy access. (See the Log Designer section for more info.)
LogPlot is shipped with a library of over 40 designs which you can use as-is or modify to suit your needs. The library contains designs for environmental, geotechnical, petroleum, mining, and general uses. Or, you can create a new design from scratch as we instruct you in later lessons in this tutorial. Below is an example of how a very simple lithology log design file ("lithology 1.ldfx8") looks when viewed in the Log Design window:
Compiled logs are displayed in the Log View window, where you can scroll up and down through the log pages. From the View window you can print and export your graphic logs. (See the Log View section for more info.)

The Project Manager pane along the left edge of the program window displays all of the data, design, and plot files in the current project folder, for quick opening and compiling.

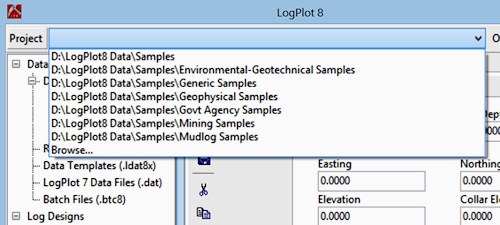
Use the Project button to open a different Project Folder. The sample folders installed with LogPlot are shown here:
![]() Back to main menu | Next Section (Compile a Simple Lithology Log)
Back to main menu | Next Section (Compile a Simple Lithology Log) ![]()
![]()