Introduction
Example
How to enter Symbol Data
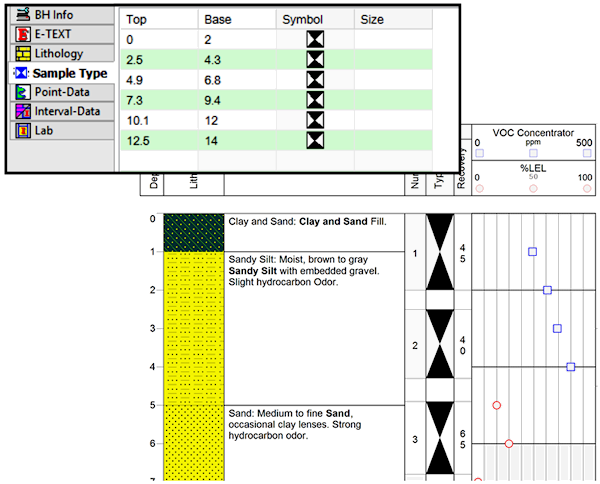
Use: The LogPlot Symbol datasheet is used to enter depths and symbol numbers for plotting a variety of different graphic symbols in a Symbol column in the body of the log. These symbols can be "vector" symbols such as
or "interval" symbols such as
.
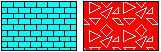
Note that some people use the word "symbol" in the context of representing lithologic materials. In LogPlot and RockWorks we use the term "patterns" to denote this type of repeating graphic block, such as shown here:
If you wish to insert symbols in the header or footer of the log, that is done within the Log Designer, using the Header/Footer Symbol tool.
See also the new Water Level datasheet which is specific to the display of water level symbols and bars, and the Point Symbol datasheet which is fully compatible with RockWorks but supports only vector symbols.
Corresponding log design component: Data listed in this datasheet will be plotted on the log in the Symbol column of the same name.
Corresponding RockWorks data table: Symbol (with loss)
Right-Click Options: When you right-click in the Symbol datasheet's cells, you have the following options:
Cut, Copy, Paste Insert/Append/Delete Rows Manipulate Columns Fill Depth Column Edit Data Page Name Delete Data Page Move
This example illustrates the use of a Symbol column to plot interval (raster) symbols representing sample intervals.
Automatic:
If there is already a Symbol column in the current log design to which you will be linking the data, you can use the Data | Update Data File from Log Design option to insert a new Symbol datasheet in the current data file. The program will know how to name the tab based on the log design information.
Manual:
Select the Data | New Data Page | Symbol menu option to manually insert a Symbol datasheet.
New Name: Type in the name to assign to the datasheet. LogPlot will use this name to match data to the item in the log design.
Click OK.
The program will add to the data file a Symbol datasheet labeled with the selected name and with 4 blank columns: Depth to Top, Depth to Base, Symbol, and Size.
Name: The name displayed on the datasheet tab is used to match the data to a particular Symbol column in the log design. This name is declared when you first create the data page (above) and can be edited using the Data | Edit Data Page Name option.
Single Depth, Vector Symbols:
Top: In this column, list the single depth at which you want the vector symbol to be plotted (the symbol's origin - usually its center - will be placed at the declared depth).
Symbol: Double-click on the Symbol cell to bring up the Symbol Selector window. Select the Vector symbol to be plotted at the listed depth in the log. You can also choose the color in which it is to be displayed.
Size: Type in the size at which the symbol is to be plotted, expressed in decimal inches. An entry of "0.25" would plot the symbol at a size of one-quarter inch (or cm.), regardless of the vertical scaling of the log.
Depth Interval, Interval Symbols:
Top, Base: List the depths for the top and base of the interval symbol.
Symbol: Double-click on the Symbol cell to bring up the Symbol Selector window. Select the Interval symbol to be plotted at the listed depth in the log. You can choose the color in which it is to be displayed.
Back to LogPlot Datasheet Summary