This example illustrates how the blue curve is displayed at a scale from 5 to 8, and then from a scale of 0 to 5 starting at a depth of 465.

Introduction
Example
How to enter the Scale Table Data
Use: The LogPlot Scale Table datasheet is used to enter one or more depth ranges and a new minimum and maximum value range for a curve column. As LogPlot compiles the data, it will plot the curve using the default horizontal scaling, but will change the scale as declared for the Scale Table depth interval(s). For example, if a Curve column is set up to plot the curve from 0 to 20, you can use a Scale Table to define a top and base depth within which the curve will be plotted from 0 to 100 instead.
Corresponding log design component: Data entered in this datasheet will affect the plotting of data in the Curve column of the same name.
Corresponding RockWorks data table: none
Right-Click Options: When you right-click in the Scale Table datasheet's cells, you have the following options:
Cut, Copy, Paste Insert/Append/Delete Rows Manipulate Columns Edit Data Page Name Delete Data Page Move
This example illustrates how the blue curve is displayed at a scale from 5 to 8, and then from a scale of 0 to 5 starting at a depth of 465.
Select the Data | New Data Page | Scale Table menu option.
New Name: Type in the name of the Curve column in the log design to which this data page is to be linked.
Click OK.
The program will add to the data file a Scale Table datasheet labeled with the selected name, and with 4 columns: Top, Base, Minimum Value, and Maximum Value.
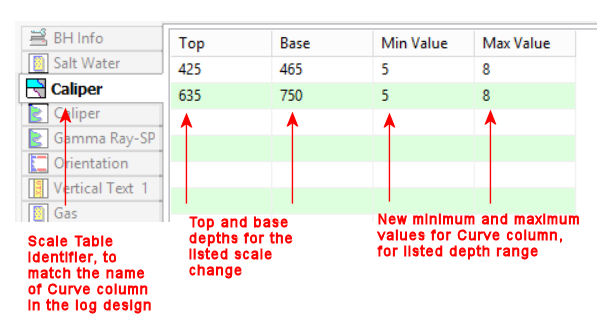
Name: The name displayed on the data tab is used to match the data to a particular Curve column in the log design. This name is declared when you first create the data page (above) and can be edited using the Data | Edit Data Page Name menu option.
Top, Base: In these columns you must list the depth at the top and the base of the interval where the curve scale is to be changed. Any data outside these depth ranges will be scaled as defined as default in the log design.
Min Value and Max Value: Here you can enter the range of data values to be represented in the curve column for the defined depth interval.
Notes:
![]() Back to LogPlot Datasheet Summary
Back to LogPlot Datasheet Summary
![]()