This illustrates the use of a Bitmap column to show a scanned raster log in the body of the LogPlot log.

Introduction
Example
How to enter Bitmap Data
Use: The LogPlot Bitmap datasheet is used to specify the name of a graphic image (in a raster format) and the beginning and ending depth at which it should be plotted in the Bitmap column in the body of the log. This can be used to display images of core samples, fossils, raster logs, or other items. Multiple bitmaps may be plotted in a single column.
! Bitmaps in the header or footer of the log (logos, etc.) are inserted into the log design itself. See Header/Footer Pictures.
Corresponding log design component: Data entered into the Bitmap datasheet will be plotted within the Bitmap column of the same name, if any.
Corresponding RockWorks data table: Bitmaps
Right-Click Options: When you right-click in any of the Bitmap datasheet cells, you have the following options:
Cut, Copy, Paste Insert/Append/Delete Rows Manipulate Columns Edit Data Page Name Delete Data Page Move
This illustrates the use of a Bitmap column to show a scanned raster log in the body of the LogPlot log.
Automatic:
If there is already a Bitmap column in the current log design to which you willl be linking the data, you can use the Data | Update Data File from Log Design tool to insert a new Bitmap datasheet in the current data file. The program will know how to name the tab based on the log design information.
Manual:
Select the Data | New Data Page | Bitmap menu option to manually insert a Bitmap datasheet.
New Name: Type in the name to assign to the datasheet. LogPlot will use this name to match data to the item in the log design.
Click OK.
The program will add to the data file a Bitmap datasheet labeled with the selected name.
Filename: Double-click in this cell to browse for and select the name of the image file to be included in the log. If the file is not in the same folder as the LogPlot data file, the full path to the file will be stored in the data file rather than just the name of the file.
! Important: If, in the log design, you have set up the Bitmap Column to link to the image file to the log rather than imbedding the image in the log, be careful how you manage your files:
- If the image is in the same folder as the data file, and the datasheet displays the name of the file only, with no directory path, then the link will also be recorded that way when you save the compiled log. If the compiled log is ever moved to another folder or another computer, and it is re-opened, the program will simply look in the current folder for the image file. As long as you keep the compiled log (LPT8) and the image file (TIF, PNG, BMP, etc.) in the same folder, regardless of where that folder is, the link can be maintained.
- If the image is in a different folder than the data file, and the datasheet displays the full path to the image file (such as "C:\Project_A\Jefferson Site\raster_log_032134.tif"), then that is also how the link will be saved in the compiled log. If you move the compiled log to another folder/machine and try to re-open it, the program will look for the linked image using the full path information. If the image file cannot be located, it will be omitted from the log image when opened.
If you have set up the Bitmap Column to embed the image file(s) in the log, then it will only be at compile time that LogPlot will look for the image; once saved in the LPT8 file it will not be linked.
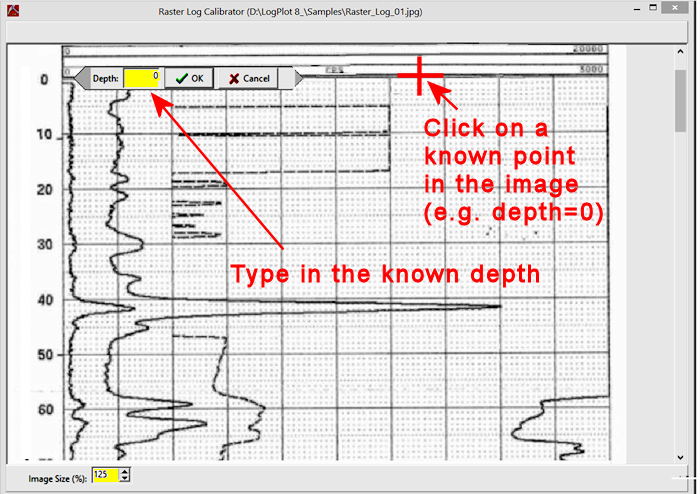
You'll now see the Raster Log Calibrator window with the image displayed. You will see a prompt at the top of the window: Click on point at top of log or press enter for top... You can use the scroll bars to view portions of the image outside the current window, and the Image Size prompt at the bottom to zoom in and out of the image display.
Click on a point at/near the top of the log where the depth is known. If the log has a background grid with depth labels, that can be a good choice.
Once the point has been selected, you will be prompted to enter the depth at that location. Type in the depth and click OK. The depth values must be positive. A red horizontal line will be drawn at the designated depth.
Use the scroll bars along the right side of the window to scroll down in the log to click on a point at/near the base of the log where the depth is known.
Enter the depth at that location and click OK.
Define the clipping:
Choose Clip Based on Calibration Points if you want the image to be cropped above the upper and below the lower calibration points.
Choose Add Top and Bottom Clip Points if you want to clip the image using different crop points.
Choose No Clipping if the entirety of the image is to be displayed in the LogPlot log.
If you choose to add new clip points, you will be prompted to Click on Clipping Point at Top of Log, then Click on Clipping Point at Base of Log.
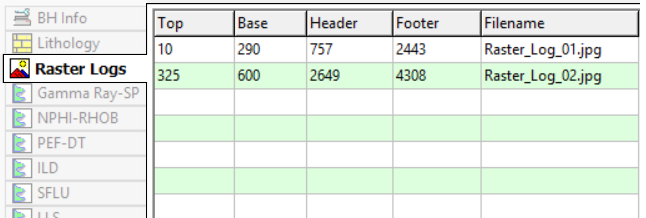
The Raster Log Calibrator screen will disappear and the appropriate information be computed and displayed within the Bitmaps tab. The file name, depths, and clipping points in the image will be displayed in the datasheet.
![]() Back to LogPlot Datasheet Summary
Back to LogPlot Datasheet Summary
![]()