These options are displayed when you double-click on a solid model name in the Project Manger window, or when you right-click on a solid model name and select the Display Solid option.
Menu Options
Step-by-Step Summary
Menu Options
- Input Columns: Use these prompts, along the left side of the window, to define the columns in the RockWorks Utilities datasheet that list the XYZ(G) data from which the solid model was interpolated.
! These input prompts will be used ONLY IF you activate the Control Points image layer (see below). These settings will be ignored if you don't turn on the Control Points layer.
- X (Easting), Y (Northing), Z (Elevation): Choose the datasheet columns where these input data are stored. These define the 3D location of the sample points.
- Diagram Type: Choose from one of the following. (More.)
- All Voxels: Click in the All Voxels radio button to represent the solid model in the 3D display as color-coded voxels. This is a good option for lithology models and solid stratigraphy models. You can choose to display either the Full Voxel, or just the Midpoint. Display of the midpoint only can significantly improve display time for huge models.
- Isosurface: Click in the Isosurface radio button to display the solid model as if enclosed in a "skin." This view will be smoother than a voxel display and is good for real-number geochemistry, geophysical, geotechnical (etc.) models.
- Iso-Mesh: Use this option to plot a series of polylines that represent three-dimensional contours at a user-defined cutoff. Expand the heading to establish the settings. (More.)
- Color Scheme: Click on the Options button to define the display's color scheme - automatic, table-based, etc. (More.)
- Reference Cage: Insert a check here to include vertical elevation axes and X and Y coordinate axes in the 3D diagram. Expand this item to set up the cage items. (More.)
- Include Legend: Insert a check here to include an index to the colors and G values in the fence diagram. (More.)
- Control Points: Insert a check here to include 3D spheres representing the XYZ(G) control point values as read from the RockWorks Utilities datasheet. Be sure you've specified the input columns along the left side of the window. (More.)
! DO NOT activate this image layer if you don't have the XYZ(G) data listed in the RockWorks Utilities datasheet.
- Plot Logs: Check this box to append striplogs to your 3D diagram.
! DO NOT activate this image layer if you don't have data entered into the Borehole Manager.
- Clip Logs: Check this sub-item if you want to restrict the logs to a particular elevation range.
- 3D Striplog Designer: Click on the 3D Striplog Designer tab to the right, to select the items to display in the individual logs to plot with the model.
-
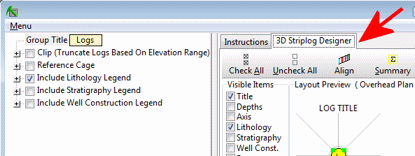
- Visible Items: Use the check-boxes in the Visible Items column to select which log items are to be displayed. See Visible Item Summary for information.
- Options: Click on any of the Visible Items names to see the item's settings in the Options pane to the right. See Visible Item Summary for links to the Options settings.
- Layout Preview: For each item you've activated, you'll see a preview cartoon in the upper pane, showing an overhead view of the log columns. Click and drag any item to rearrange the log columns; click and drag the circle handles to resize a column. See Using the 3D Log Designer.
Step-by-Step Summary
- Access the Project Manager pane of the program, along the left side of the RockWorks program window.
- Expand the Solid Models heading, if necessary.
- Double-click on the name of the existing solid model (.RwMod file) that you wish to visualize.
- Select the type of output you want, as listed above.
- Click the Process button to continue.
The program will read the selected solid model file and generate the requested diagram, which will be displayed in a RockPlot3D tab in the Options window.
- You can adjust any of the settings in the Options window and then click the Process button again to regenerate the diagram.
! Each time you click the Process button, the existing display will be replaced.
- View / save / manipulate / export / print the diagram in the RockPlot3D window.

RockWare home page